
Whitepaper VI
Accurate Overpotential and Reference Electrode Measurements in Water Electrolysis Using the 1 cm² M-Cell
Mikkel Kongsfelt
Introduction
This whitepaper concerns the M-cell, a multipurpose 1 cm² electrochemical research cell developed by Redox-Flow.com (www.redox-flow.com). The M-cell is designed for maximum flexibility: by changing the gasket configuration and the current collectors, a single compact platform can be reconfigured into closed cell, open cell, half-cell, and three-compartment setups. Its small 1 cm² active area makes it particularly well suited for testing and screening of catalysts, novel membranes, and other materials that are only available in limited quantities. A key unique feature of the cell is its advanced reference electrode system, in which one or more Luggin capillaries ensures well-defined reference electrode locations inside the cell with a spatial precision better than approximately 0.2 mm.
Because of this modularity, the M-cell can be applied across a wide range of electrochemical disciplines. The same hardware can be configured for alkaline water electrolysis (AWE), anion-exchange-membrane (AEM) and proton-exchange-membrane (PEM) electrolysis, redox flow batteries, CO₂ reduction, and electrodialysis.
The present whitepaper focuses exclusively on alkaline water electrolysis, studied in three different cell configurations (see manual https://redox-flow.com/product/m-cell-full-cell-2/ for more information on the configurations):
- Part 1 – Open cell configuration with one common reference electrode
- Part 2 – Closed cell configuration with one common reference electrode
- Part 3 – Closed cell configuration with two independent reference electrodes
This whitepaper demonstrates the use of the 1 cm² M-cell, focusing on accurate reference electrode measurements and on the challenges that gas bubbles create in the Luggin capillaries. During electrolysis, bubbles can enter or fully block the capillaries and add noise to the measured potentials; the work shows how controlled electrolyte flow in both the main cell circuit and the reference electrode circuit keeps these measurements stable. Performance tests — polarisation curves, separated hydrogen and oxygen overpotentials, temperature control, and an iron-addition example — are also included.
Each of the three parts can be read separately but refers to the others where relevant, and is best read together with the M-cell assembly manual (under Resources at https://redox-flow.com/product/m-cell-full-cell-2/).
Key Takeaways
The main conclusions and practical recommendations from the tests presented in this whitepaper are summarised below.
Bubble formation can be a significant source of noise in both the cell potential and the reference electrode measurements. The most effective way to mitigate this is to maintain electrolyte flow through the reference electrode hydraulic circuit (the Luggin capillaries), which clears bubbles from the capillaries and keeps the potential measurement stable.
- The reference electrodes of the M-cell can be configured in almost endless ways. In many cases it is advantageous to connect the reference electrode circuit to the electrolyte beakers/reservoir for continuous circulation, creating a more stable system. This can introduce shunt currents and voltages in the reference electrode circuit, but in most cases these can be minimised through careful selection of the tube length and inner diameter.
- Establishing flow in the reference electrode circuit does not necessarily require a third pump. It can be achieved either by adding a third pump head to the existing peristaltic pump or by exploiting the pressure differences already present in the main hydraulic circuit.
- Before relying on reference electrode measurements, a detailed analysis of the hydraulic and electronic circuit should be carried out to identify potential shunt currents and their implications for the measured potentials.
Several of these points are discussed in further detail in the M-cell assembly manual (available under Resources at https://redox-flow.com/product/m-cell-full-cell-2/), which should be consulted alongside this whitepaper.
Part 1 – Open cell configuration with one common reference electrode
All experiments were performed using commercially available electrochemical research equipment from www.redox-flow.com. The electrochemical cell used in this study was the 1 cm² M-cell, a multipurpose electrochemical test cell designed for advanced electrochemical investigations and flexible reference electrode configurations (Fig. 1.1). The cell includes integrated ports for electrolyte flow and for Luggin capillary reference electrode measurements. The reference electrode (Hg/HgO) was connected through a flow-through reference electrode unit positioned outside the cell and connected to the cell via Luggin capillaries.

The test setup consisted of a 6 V / 5 A power supply equipped with an AUX measurement unit that records potentials from reference electrodes and temperature sensors. All voltage and current data were recorded with a resolution of 1 s. Nickel electrodes with a porosity of 150 ppi and a thickness of 1.7 mm were used as both anode and cathode. The electrolyte was 6 M KOH.
The M-cell was operated in an open cell configuration (see assembly manual for M-cell for more details – https://redox-flow.com/product/m-cell-full-cell-2/ ) and placed inside a multiport electrolyte reservoir containing the electrolyte solution. In this configuration the cell was immersed in the electrolyte reservoir while electrolyte was continuously circulated through the cell using external tubing connections. Two peristaltic pumps were used to control electrolyte flow. The first pump, equipped with two pump heads, circulated electrolyte through the main cell circuit. This circuit supplied electrolyte to the cell through the main inlet ports and returned it to the reservoir. The second pump was used to circulate electrolyte through the reference electrode circuit connected to the Luggin capillaries. The hydraulic layout of the system is illustrated in Fig. 1.2. In this figure the blue circuit represents the main electrolyte flow through the electrochemical cell, while the red circuit represents the reference electrode circuit connected to the Luggin capillaries. Electrolyte in both circuits was pumped from the reservoir into the cell to minimise the influence of gas bubbles formed during electrolysis.

Effect of Bubbles on Cell Potential Measurements
Figure 1.3 shows the measured cell potential Ucell as a function of time for different electrolyte flow rates in the main cell circuit. Also, two different configurations were investigated for the reference electrode circuit. One with no electrolyte flow was applied through the reference electrode circuit (0 mL min⁻¹), the other with a flow rate of 1.5 mL min⁻¹. Unlike conventional polarisation curves where voltage is plotted as a function of current density, the data here are presented as a time series in order to highlight the influence of bubble formation on the stability of the voltage signal. All experiments were performed at room temperature.
At low current densities Ucell remains relatively stable with minimal fluctuations. For example, at a flow rate of 25 mL min⁻¹ the voltage signal shows almost no measurable noise up to approximately 250 mA (250 mA cm⁻²). In this regime the gas production rate is relatively low and bubbles formed at the electrode surface are transported away by the electrolyte flow. As the current increases, the rate of gas evolution also increases and the measured voltage begins to exhibit noticeable fluctuations/noise in Ucell that becomes very pronounced at the highest current densities. The inset of Fig. 1.3 shows a zoomed-in plot of the time series data for 1400 mA. The standard deviation of the measured cell voltage, denoted by σ, is used as a quantitative measure of the noise level in the signal. The data demonstrate that the standard deviation decreases with increasing electrolyte flow rate through the cell.
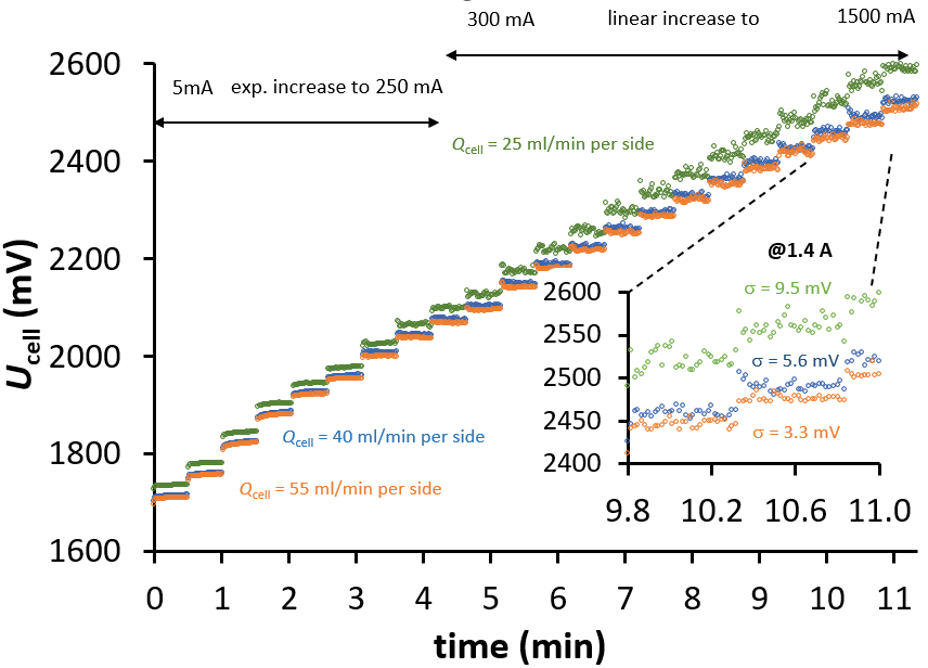
Figure 1.3 – Measured cell potential Ucell as a function of time for different electrolyte flow rates in the main cell circuit during alkaline water electrolysis in 6 M KOH at room temperature. Increased electrolyte flow rates reduce fluctuations in the measured cell voltage by improving bubble removal from the electrode surfaces. The inset shows a magnified region at high current where the standard deviation σ of the voltage signal is used to quantify measurement noise.
This trend can be explained by higher electrolyte flow rates transporting bubbles away more efficiently, thereby reducing their influence on the local current distribution and effective resistance of the solution. The gas bubbles are non-conductive, so when they occupy space in the flow path, they displace the ionically conductive liquid and force the current through a more tortuous path, resulting in a varying ohmic resistance. As a result, the measured cell potential becomes more stable and the noise level decreases.
Effect of Bubbles on Reference Electrode / Overpotential Measurements
Figure 1.4 shows the measured overpotentials at room temperature for hydrogen evolution and oxygen evolution obtained using one common reference electrode (whereby Ucell = 1.23 V + ηH2 + ηO2 all times). Similar to Fig. 1.3, the data are presented as a function of time in order to focus on the fluctuations in the measured potentials. Three different electrolyte flow rates in the main cell circuit were investigated. For each of these flow rates, measurements were performed both with and without electrolyte flow in the reference electrode circuit. It is emphasized that these measurements are not intended as performance tests of the electrochemical system. Instead, the purpose of the experiments is solely to investigate how bubbles influence the noise level in reference electrode measurements.
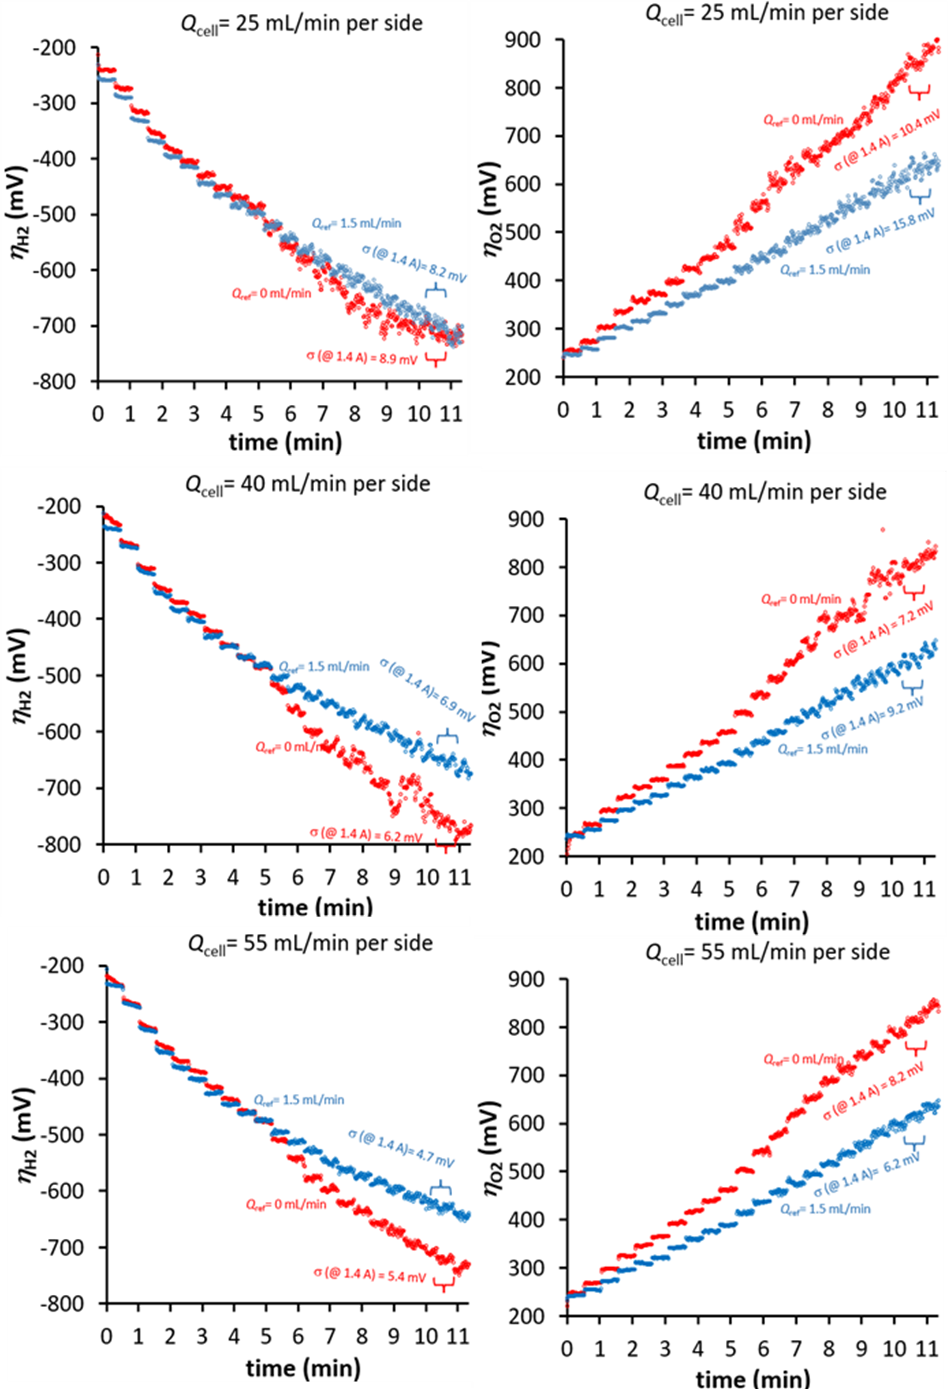
The results show two clear trends. First, the presence of electrolyte flow in the reference electrode circuit generally reduces the noise in the measured overpotentials. When electrolyte is pumped through the Luggin capillary circuit, bubbles that might otherwise enter or accumulate in the capillaries are removed, leading to a more stable potential measurement.
Second, increasing the electrolyte flow rate in the main cell circuit also reduces the noise in the measured potentials. Higher flow rates enhance the removal of bubbles from the electrode surfaces and electrolyte channels and reduce fluctuations in the measured cell voltage Ucell. The observed noise in reference electrode measurements can therefore be attributed to two main effects. The first contribution originates from fluctuations in the cell potential Ucell. Since overpotentials are partly related to the measured cell voltage, any noise in Ucell will propagate into the calculated electrode potentials. The second contribution arises from the interaction of bubbles with the Luggin capillary and reference electrode circuit itself. Bubbles generated during electrolysis may enter the capillary system or temporarily block the electrolyte pathway between the cell and the reference electrode. These disturbances introduce additional noise in the measured potential signal.
A small intrinsic measurement noise may also be present due to the high impedance of the reference electrode, typically on the order of 5–10 kΩ. The magnitude of this noise depends highly on the voltage measurement electronics quality. However, in present context the experiments demonstrate that the dominant contribution to the observed noise originates from bubble formation and its interaction with both the main electrolyte circuit and the reference electrode circuit.
Stability of reference electrode measurements
The results above show that noise in potential measurements can originate both from bubbles formed at the electrode surfaces and from bubbles entering the Luggin capillary / reference electrode circuit. The short-term measurements clearly demonstrate these effects, but for practical electrochemical testing it is equally important to assess whether the reference electrode measurements remain stable over longer timescales.
An example of this is shown in Fig. 1.5, where the same experimental configuration was operated at 90 °C and a constant current of 1000 mA (1000 mA cm⁻²). The measured cell potential, Ucell , remains relatively stable throughout the experiment, and the hydrogen and oxygen overpotentials, ηH2 and ηO2, are also initially stable. During the first part of the experiment there is no flow through the reference electrode circuit. After approximately 12 min, the measured ηH2 and ηO2 begin to drift and become highly noisy, even though Ucell itself remains stable. This shows that the instability is caused primarily by bubbles blocking the Luggin capillaries. When the pump for the reference electrode circuit is switched on, the measured overpotentials immediately become stable again and return to the same magnitude as before the drift started.
Together, the results show that bubble formation influences both cell potential and reference electrode measurements. The effect is impossible to predict, but depends on factors such as the cell flow rate, temperature, electrode properties, and gasket geometry. In general, higher cell flow rates and higher temperatures reduce the effect of bubbles. For long-term measurements with reference electrodes flow in the reference electrode circuit ensures stability.
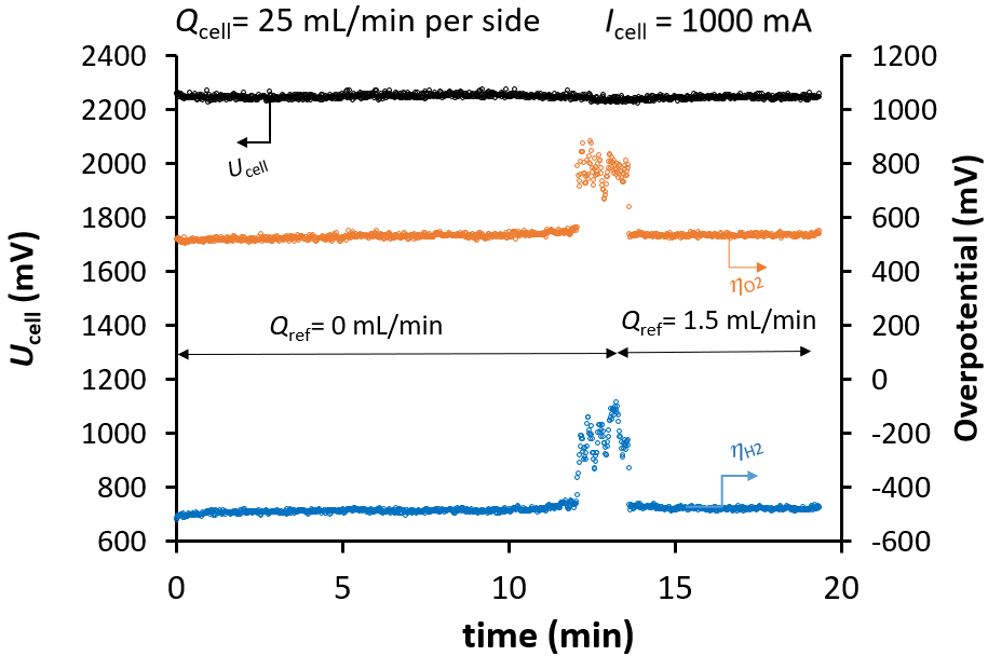
Figure 1.5 – Cell potential, Ucell , and overpotentials for hydrogen evolution, ηH2 , and oxygen evolution, ηO2 , as a function of time at 90 °C and a constant current of 1000 mA (1000 mA cm⁻²). During the first approximately 14 min, no flow is applied through the reference electrode circuit. After this point, flow through the reference circuit is switched on. The data show that blockage of the Luggin capillaries leads to unstable and noisy overpotential measurements, while flow through the reference circuit restores stable signals.
If long-term stable reference electrode measurements are required, flow through the reference electrode circuit is needed, either by a pump or a person operating a syringe during the experiment. A direct placement of the reference electrode inside the flow cell is not an attractive alternative. First, bubbles may also block the frit of a directly inserted reference electrode. Second, operation at elevated temperatures such as 90 °C may damage or shorten the lifetime of the reference electrode. Third, the Luggin capillary approach allows highly localized potential measurements with a spatial resolution better than approximately 0.2 mm, whereas a directly inserted reference electrode would provide a much less well-defined measurement position.
Internal consistency of reference electrode measurement points
This section demonstrates the accuracy and positional consistency of the measurement points defined by the Luggin capillaries. Fig. 1.6 illustrates an experimental setup with two reference electrodes that are connected to individual Luggin capillaries with measurement points located at the surfaces of the anode and cathode, respectively. The distance between the two measurement points is defined by a spacer gasket of thickness 0.55 mm, which also corresponds to the inter-electrode spacing in the cell. The voltage difference between the two reference electrodes, ΔUref, is measured as a function of current in order to determine the electrolyte resistance between these two precisely defined points.
Figure 1.7 shows ΔUref as a function of current density. From the slope of this relationship, an electrolyte resistance of 0.0894 Ω is obtained. Using the known distance between the measurement points, L = 0.55mm, and a cross-sectional area of 1 cm², the electrolyte conductivity, κ, can be calculated from

where R is the measured resistance and A is the cross-sectional area. Inserting the experimental values gives an electrolyte conductivity of approximately 0.61 S cm⁻¹.

Figure 1.6 – Hydraulic layout used for evaluating the internal consistency of the reference electrode measurement points. The blue circuit represents the main electrolyte flow through the cell, while the red circuits represent the two individual reference electrode circuits connected to Luggin capillaries on the anode and cathode side. The potential difference between the two reference electrodes, ΔUref , is measured. The distance between the electrodes is 0.55 mm, which also defines the spacing between the two reference electrode measurement points.
This value is in very close agreement with literature values for 6 M KOH at room temperature, which are around 0.63 S cm⁻¹. [1] The agreement is well within normal experimental uncertainty and strongly supports that the reference electrode measurement points are both spatially well defined and internally consistent. In other words, the Luggin capillaries do not merely provide qualitative potential measurements, but can define localised measurement positions with sufficient precision to reproduce the expected electrolyte conductivity over a sub-millimetre distance. This ability to make accurate local measurements on the sub-mm scale is a central advantage of the M-cell design.
Performance tests
The preceding sections have focused on demonstrating the capabilities and limitations of the 1 cm² M-cell in terms of noise and stability. The present section focuses on the electrochemical performance that can be obtained with the setup. Using the experimental configuration shown in Fig. 1.2, polarisation curves together with hydrogen and oxygen overpotentials were measured by recording the potentials as a function of time at a series of applied currents. Each current step was held for 60 s, and the reported values were constructed as the average of the final 30 s of each step. The present data compare operation at room temperature (RT, 22 °C) and 90 °C, and the results are shown in Fig. 1.8.
Overall, the polarisation curves at room temperature and 90 °C show similar shapes, but the total cell potential at 90 °C is approximately 200 mV lower across much of the investigated current range, as expected from the improved electrochemical kinetics and electrolyte transport at elevated temperature. When the overpotentials are separated into contributions from the hydrogen evolution reaction and the oxygen evolution reaction, it becomes clear that the main improvement comes from the hydrogen side.
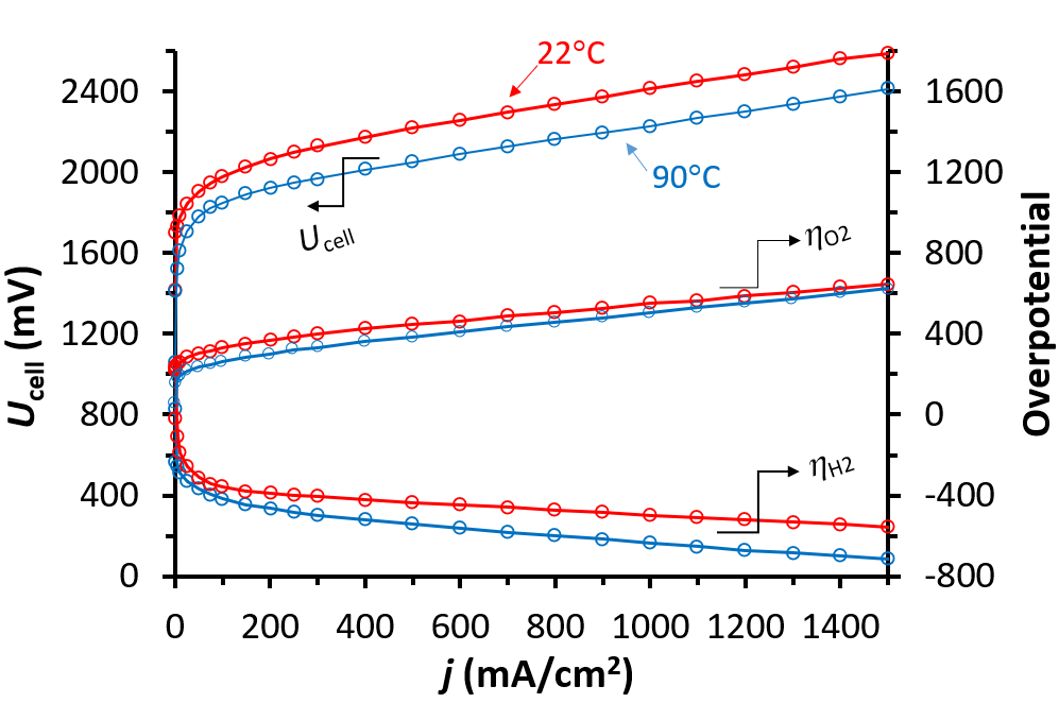
The oxygen overpotential remains relatively similar at room temperature and 90 °C, whereas the hydrogen overpotential decreases by approximately 200 mV upon heating.
The main point of this section is not to make conclusions on optimisation, but rather to demonstrate the performance measurement capabilities of the setup. Here, the key capability highlighted is the ability to measure the hydrogen and oxygen overpotentials accurately and simultaneously on both sides using a common reference electrode in a compact 1 cm² cell. Combined with the multiport reservoir and its integrated temperature-control capability, this provides a highly flexible tool for studying or screening electrode materials, catalyst activity, activation behaviour, and temperature effects under well-defined electrochemical and hydrodynamic conditions, and for comparing anode and cathode behaviour within the same platform.
Heating with multiport reservoir
Heating and accurate temperature control are often overlooked or poorly integrated in commercial and state-of-the-art electrochemical test systems. In contrast, the Redox-Flow.com multiport reservoir is designed with integrated heating possibilities and can be placed directly on standard laboratory hotplates equipped with an external thermometer and temperature controller. This makes elevated-temperature electrochemical testing simple and robust.
For the room-temperature and 90 °C experiments shown in Fig. 1.8, temperature control was achieved using a 600 W plate heater with an external thermometer / temperature controller. The temperature evolution during heating to the 90 °C setpoint is shown in Fig. 1.9. One thermometer was placed in the 316L heating block, which is in direct contact with the heater plate. A second thermometer was placed directly in the 6 M KOH electrolyte and used as the controlling thermometer. A third thermometer measured the ambient temperature outside the reservoir. The data show that the target temperature of 90 °C is reached rapidly, in practice after only about 20 min. This demonstrates that the combined reservoir and heating-block design provides efficient heat transfer to the electrolyte while maintaining straightforward external control of the operating temperature.
Part 2 – Closed cell configuration with one common reference electrode
All experiments were performed using commercially available electrochemical research equipment from www.redox-flow.com. The electrochemical cell used in this study was the 1 cm² M-cell, a multipurpose electrochemical test cell designed for advanced electrochemical investigations and flexible reference electrode configurations (Fig. 2.1). The cell includes integrated ports for electrolyte flow and for Luggin capillary reference electrode measurements. The reference electrode (Hg/HgO) was connected through a flow-through reference electrode unit positioned outside the cell and connected to the cell via Luggin capillaries.

The experimental setup consisted of a 6 V / 5 A power supply equipped with an AUX measurement unit that records potentials from reference electrodes and temperature sensors. All voltage and current data were recorded with a resolution of 1 s. Nickel electrodes with a porosity of 150 ppi and a thickness of 1.7 mm were used as both anode and cathode. The electrolyte was 6 M KOH.
The M-cell was operated in a closed cell configuration and placed inside a multiport electrolyte reservoir containing the electrolyte solution (see M-cell assembly manual for more details – https://redox-flow.com/product/m-cell-full-cell-2/ ). In this configuration the cell was connected to the electrolyte reservoir while electrolyte was continuously circulated through the cell using external tubing connections. Two peristaltic pumps were used to control electrolyte flow. The first pump, equipped with two pump heads, circulated electrolyte through the main cell circuit. This circuit supplied electrolyte to the cell through the main inlet ports and returned it to the reservoir. The second pump was used to circulate electrolyte through the reference electrode circuit connected to the Luggin capillaries. The hydraulic layout of the system is illustrated in Fig. 2.2. In this figure the blue circuit represents the main electrolyte flow through the electrochemical cell, while the red circuit represents the reference electrode circuit connected to the Luggin capillaries. Electrolyte in both circuits was pumped from the reservoir into the cell to minimise the influence of gas bubbles formed during electrolysis.

Effect of Bubbles on Cell Potential Measurements
Figure 2.3 shows the measured cell potential Ucell as a function of time for different temperatures and electrolyte flow rates in the main cell circuit. Unlike conventional polarisation curves where voltage is plotted as a function of current density, the data here are presented as a time series to highlight the influence of bubble formation on the stability of the voltage signal.
At low current densities Ucell remains relatively stable with minimal fluctuations. For example, at a flow rate of 10 mL min⁻¹ the voltage signal shows almost no measurable noise up to approximately 250 mA (250 mA cm⁻²). In this range the gas production rate is relatively low and bubbles formed at the electrode surface are transported away by the electrolyte flow. As the current increases, the rate of gas evolution also increases and the measured voltage begins to exhibit fluctuations/noise in Ucell that becomes pronounced at the highest current densities. However, for the 25 mL min⁻¹ flow rates at both 23 °C and 90 °C, the noise is lower. This is also seen from the inset of Fig. 2.3 which shows a zoomed-in plot of the time series data for 1400 mA. The standard deviation of the measured cell voltage, denoted by Ω, is used as a quantitative measure of the noise level in the signal. The data demonstrate that the standard deviation decreases with increasing electrolyte flow rate through the cell and the temperature of the electrolyte. This trend can be explained by higher electrolyte flow rates removing bubbles more efficiently, thereby reducing their influence on the cell voltage.
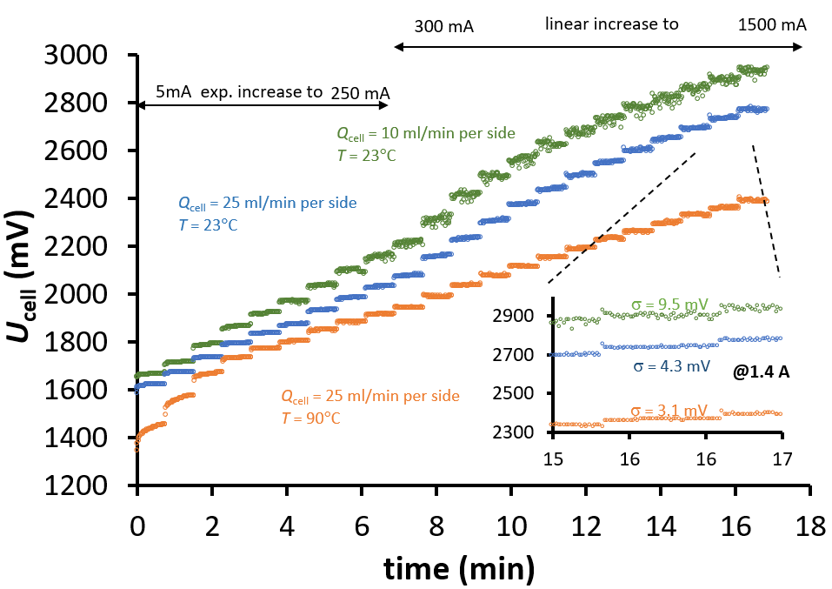
Figure 2.3 – Measured cell potential Ucell as a function of time for different electrolyte flow rates in the main cell circuit during alkaline water electrolysis in 6 M KOH at room temperature and 90°C. Increased electrolyte flow rates reduce fluctuations in the measured cell voltage by improving bubble removal from the electrode surfaces. The inset shows a magnified region at high current where the standard deviation σ of the voltage signal is used to quantify measurement noise.
Effect of Bubbles on Reference Electrode / Overpotential Measurements
Figure 2.4 shows the measured overpotentials for hydrogen evolution and oxygen evolution obtained using one common reference electrode. Besides different temperatures and flow rates in the main hydraulic circuit also two different flow rates in the reference electrode circuit were applied, one with no flow (0 mL min⁻¹), the other with a flow rate of 1.5 mL min⁻¹.
The overpotentials are calculated relative to the thermodynamic potentials of hydrogen and oxygen evolution. Due to the use of one common reference electrode Ucell = Urev + ηH2 + ηO2 at all times, where Urev is the minimum thermodynamic potential for water electrolysis and equals 1.23 V at room temperature and 1.17 V at 90 °C. The data are presented as a function of time in order to focus on the fluctuations in the measured potentials. It is emphasized that the purpose of the experiments is solely to investigate how bubbles influence the noise level in reference electrode measurements and not general performance of the electrodes/cell.
Two clear trends are seen. First, the presence of electrolyte flow in the reference electrode circuit generally reduces the noise in the measured overpotentials. Without flow, the Luggin capillary becomes blocked at around 8 min and accessible again after approximately 12 min. Second, increasing the temperature also reduces the noise in the measured potentials. This can be seen by comparing the plots at 23 °C and 90 °C.
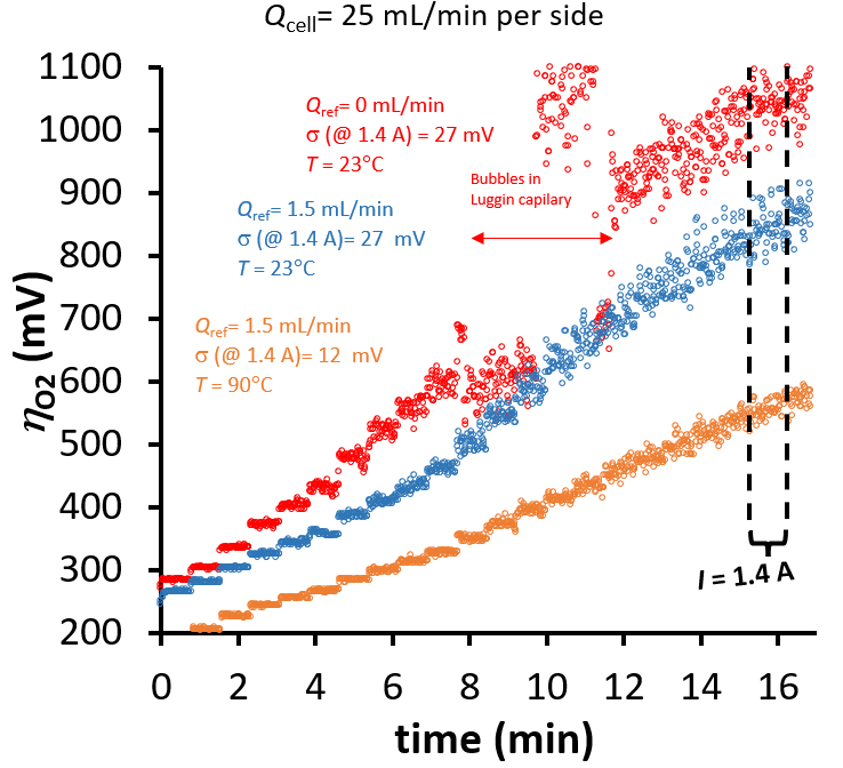
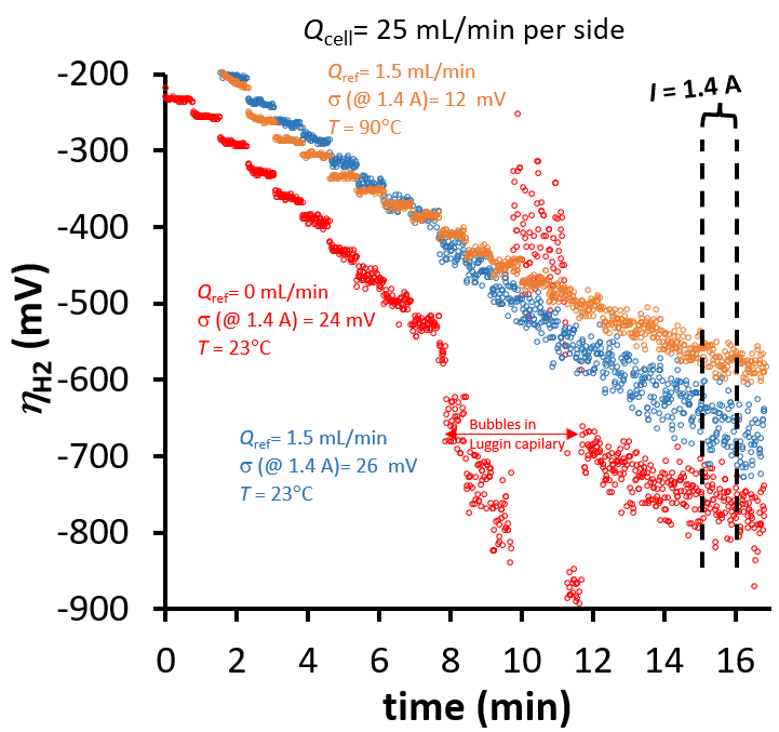
Figure 2.4 – Measured oxygen and hydrogen overpotentials obtained using a common Hg/HgO reference electrode under different electrolyte flow conditions and temperature. Measurements were performed both with and without electrolyte flow through the reference electrode circuit. Continuous flow through the Luggins capillaries significantly reduces noise in the measured.
Stability of reference electrode measurements
The results above show that noise in potential measurements can originate both from bubbles formed at the electrode surfaces and from bubbles entering the Luggin capillary / reference electrode circuit. For long term electrochemical testing stability over longer timescales (minutes to hours) may be important.
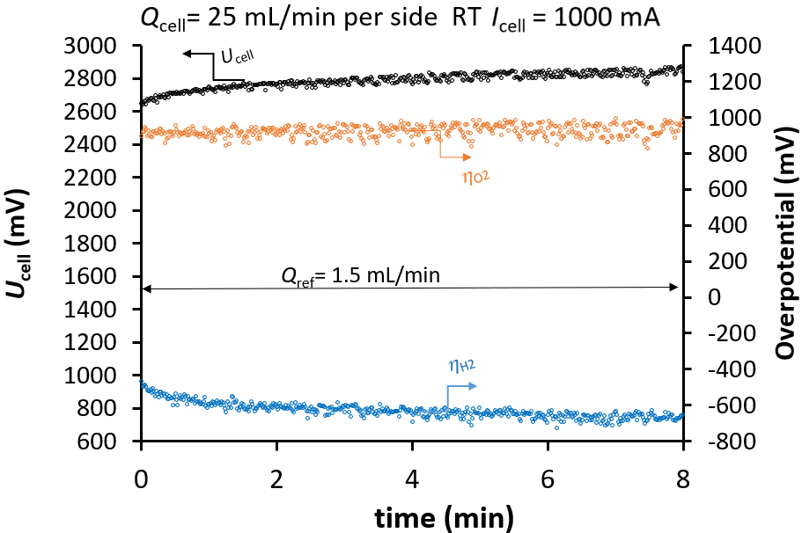
Figure 2.5 – Cell potential, Ucell , and overpotentials for hydrogen evolution, ηH2 , and oxygen evolution, ηO2 , as a function of time at 23 °C and a constant current of 1000 mA (1000 mA cm⁻²). During the whole tests flow is applied through the reference electrode circuit to demonstrate stability.
An example of this is shown in Fig. 2.5, where the same experimental configuration was operated at 23 °C and a constant current of 1000 mA (1000 mA cm⁻²) and with Qref = 1.5 mL min⁻¹. Besides increasing a little due to conditioning of the electrodes, the measured cell potential, Ucell, remains relatively stable throughout the experiment. Fig. 2.5 also includes plots of ηH2 and ηO2, here it is seen that ηO2 is fully stable at the same value throughout the experiment, while ηH2 decreases initially and is the main reason for the electrode conditioning/increasing Ucell in the experiment. This demonstrates the power of including the Luggin capillary based reference electrodes as it enables increased understanding of the electrode conditioning which in present case can be related to the cathode. Still, the main focus is stability of the measurement, and when comparing (visually) the ηH2 and ηO2 to Ucell increased noise levels are seen in the overpotentials compared to cell potential. This increased noise is attributed to bubbles interfering with the measurement. Nonetheless, noise appears to be random and using data averaging (e.g. 10 data points over 10 s) will significantly reduce this noise.
Together, the results show that bubble formation influences both cell potential and reference electrode measurements. The effect is impossible to predict, but depends on factors such as the cell flow rate, temperature, electrode properties, and gasket geometry. In general, higher cell flow rates and higher temperatures reduce the likelihood of persistent blockage because bubble transport is improved. For long-term measurements with reference electrodes flow in the reference electrode circuit ensures stability.
Performance tests
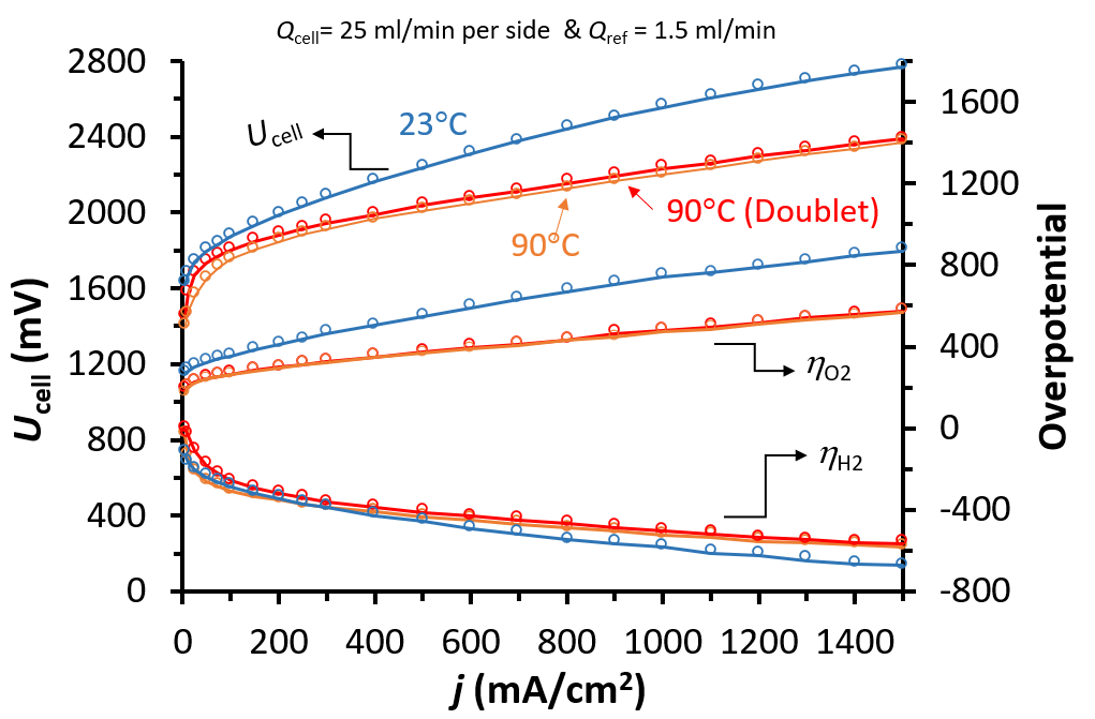
The preceding sections have primarily focused on the limitations that bubbles impose on reference electrode measurements in the 1 cm² M-cell. The present section instead illustrates the electrochemical performance that can be obtained with the setup. Using the experimental configuration shown in Fig. 2.2, polarisation curves together with hydrogen and oxygen overpotentials were measured by recording the potentials as a function of time at a series of applied currents. Each current step was held for 45 s, and the reported values were constructed as the average of the final 22 s of each step. The present data compare operation at room temperature (RT, 23 °C) and 90 °C, and the results are shown in Fig. 2.6.
Overall, the polarisation curves at room temperature and 90 °C show similar shapes, but the total cell potential at 90 °C is approximately 400 mV lower at the highest currents (1500 mA cm⁻²), as expected from the improved electrochemical kinetics and electrolyte transport at elevated temperature. When the overpotentials are separated into contributions from the hydrogen evolution reaction and the oxygen evolution reaction, it becomes clear that the main improvement comes from the oxygen side. The hydrogen overpotential remains relatively similar at room temperature and 90 °C, whereas the oxygen overpotential decreases by approximately 300 mV at 1500 mA cm⁻² upon heating. This appears somewhat contradictory to the similar plots shown in Fig. 1.8 where it was seen that decreased less and the improvement was mainly on the hydrogen side as the temperature increases. However, for alkaline water electrolysis it is known that impurities in the electrolyte and previous operation of the electrodes have a large influence on the performance/polarisation curve. As the present tests focus on demonstrating the capabilities of the M-cell, the age of the electrolyte, reuse of electrodes, etc. were not controlled, and it is anticipated that the apparently contradictory results arise from non-systematic reuse of electrodes and electrolytes.
Heating of multiport reservoir and cell
Heating and accurate temperature control are often overlooked or poorly integrated in commercial and state-of-the-art electrochemical test systems. In contrast, the Redox-Flow.com multiport reservoir is designed with integrated heating possibilities and can be placed directly on standard laboratory hotplates equipped with an external thermometer and temperature controller. Additionally, the 1 cm² M-cell has ports that enable placement of thermometers on the current collector inside the cell in order to measure and control the temperature accurately.
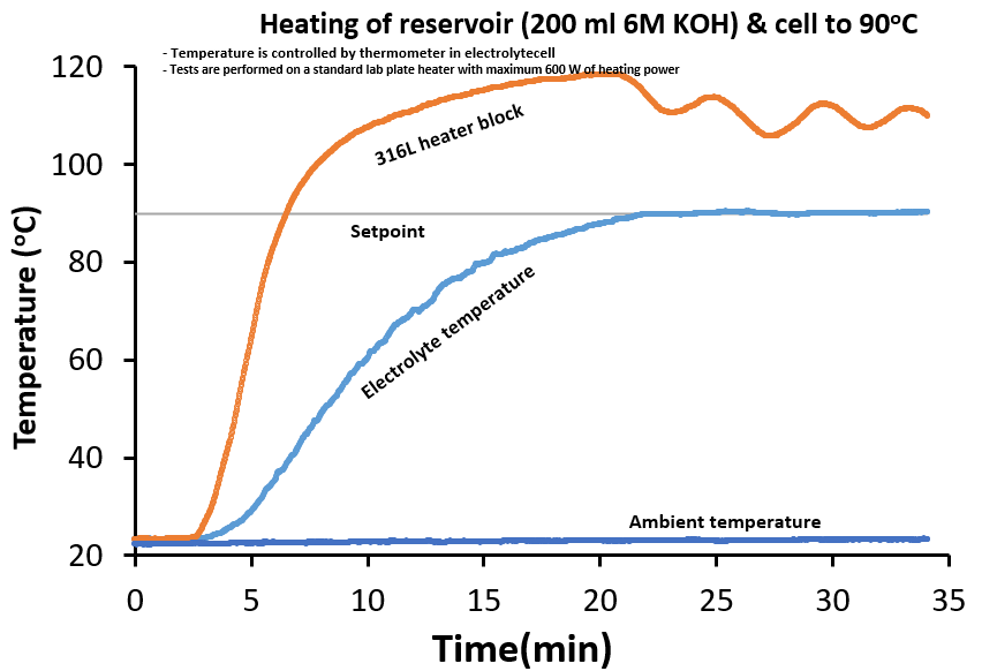
To demonstrate the temperature control capabilities a test with 200 mL pure water was made with a constant flow rate of 40 mL min⁻¹ on each side. Here the temperature of the liquid in the reservoir was controlled. Temperature control was achieved using a 600 W plate heater with an external thermometer / temperature controller in the multiport reservoir. The temperature evolution during heating to the 80 °C setpoint is shown in Fig. 2.7. One thermometer was placed in the 316L heating block, which is in direct contact with the heater plate. A second thermometer was placed directly in the water and used as the controlling thermometer. A third thermometer measured the ambient temperature outside the reservoir. Finally also a thermometer was mounted inside the M-cell on the back side of one of the current collectors. Additionally, the M-cell was placed in a thermally isolating environment (PU foam) to minimise thermal gradients in the cell and ensure accurate measurement of the temperature inside the cell. As expected, the temperature in the heating block rises first, followed by the electrolyte temperature. Target temperature of 80°C of the water in the multiport reservoir is reached rapidly within 25 min. More importantly it is seen that the temperature of the cell follows that of the water in the reservoir closely and is about 9°C lower than in the reservoir once the water temperature is reached/steady state.
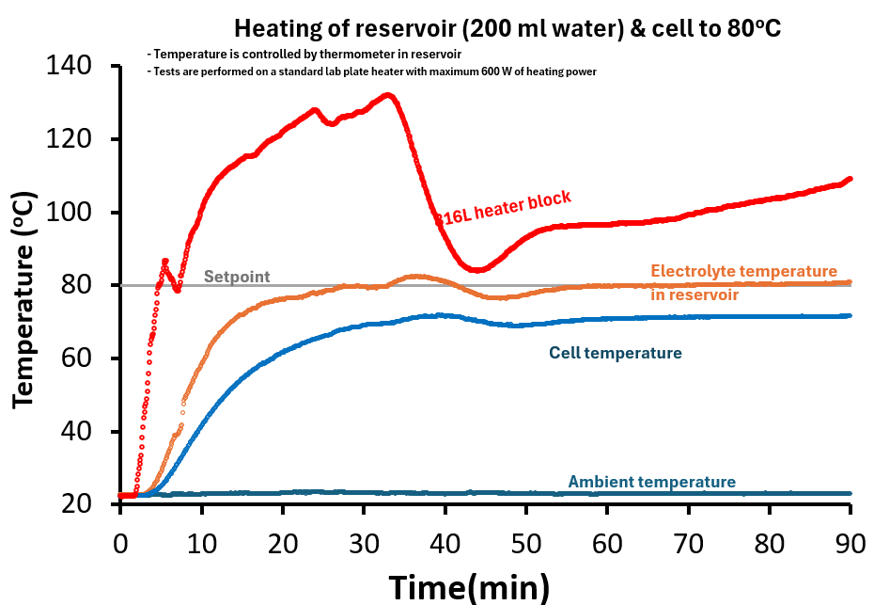
The temperature difference between the water inside the reservoir and the cell is mainly due to heat losses through the tubes from the reservoir to the cell including peristaltic tubes. In the present case each of the tubes is about 1 m long and made from PTFE with an inner diameter of 1.6 mm (1/16’’) and outer diameter of 3.2 mm (1/8’’). Making an accurate model for the temperature profile in the tubes as it approaches the cell is very difficult as it involves both PTFE/peristaltic tubes, diffusive and radiative heat losses and assumptions about the convective heat transfer around the tubes. Nonetheless, a simple model considering PTFE tubes only, at a flow rate of 40 mL min⁻¹, shows that temperature differences in the range 5 °C to 9 °C can be expected. The lower temperature difference (5°C) is with low convection around the tubes and the higher temperature difference (9°C) is with moderate/higher convection. In both cases the radiative heat loss accounts for less than 1 °C, showing that the main heat loss is through diffusive heat transfer. In any case the modelling results in temperature differences that are in the same range as the observed one.
Thus two main conclusions can be drawn from this:
- If accurate temperature control is needed, the temperature controlling thermometer should be located inside the cell
- If temperature control is done on the reservoir, the temperature difference between that of the cell and the reservoir will depend on the flow rate and tube length, where higher flow rate and lower tube length will result in lower temperature difference and better temperature control
Part 3 – Closed cell configuration with two independent reference electrodes
All experiments were performed using commercially available electrochemical research equipment from www.redox-flow.com. The electrochemical cell used in this study was the 1 cm² M-cell, a multipurpose electrochemical test cell designed for advanced electrochemical investigations and flexible reference electrode configurations (Fig. 3.1). The cell includes integrated ports for electrolyte flow and for Luggin capillary reference electrode measurements. The reference electrodes (Hg/HgO) were connected through a flow-through reference electrode unit positioned outside the cell and connected to the cell via Luggin capillaries.

The experimental setup consisted of a 6 V / 5 A power supply equipped with an AUX measurement unit that records potentials from reference electrodes and temperature sensors. All voltage and current data were recorded with a resolution of 1 s. Nickel electrodes with a porosity of 150 ppi and a thickness of 1.7 mm were used as both anode and cathode.
The M-cell was operated in a closed cell configuration and connected to a multiport electrolyte reservoir containing the 6 M KOH electrolyte solution (see M-cell assembly manual for more details – https://redox-flow.com/product/m-cell-full-cell-2/ ). Electrolyte was continuously circulated through the cell using a peristaltic pump. An additional peristaltic pump was used to circulate electrolyte through the reference electrode circuit connected to the Luggin capillaries. The hydraulic layout of the system is illustrated in Fig. 3.2. In this figure the blue circuit represents the main electrolyte flow through the electrochemical cell, while the red circuit represents the reference electrode circuit connected to the Luggin capillaries.

Electrolyte in both circuits was pumped from the reservoir into the cell to minimise the influence of gas bubbles formed during electrolysis.
Effect of Bubbles on Cell Potential Measurements
Figure 3.3 shows the measured cell potential Ucell as a function of time for different temperatures and electrolyte flow rates in the main cell circuit (Qcell) and reference electrode circuit (Qref). Unlike conventional polarisation curves where voltage is plotted as a function of current density, the data here are presented as a time series to highlight the influence of bubble formation on the stability of the voltage signal.
For all flow rates Ucell remains relatively stable with minimal fluctuations. For example, at a flow rate of 10 mL min⁻¹ the voltage signal shows almost no measurable noise up to approximately 250 mA (250 mA cm⁻²). As the current increases there is a small tendency for the noise to increase a little. Nonetheless, the inset of Fig. 3.3 shows a zoomed-in plot of the time series data for 1400 mA. The standard deviation of the measured cell voltage, denoted by σ, is used as a quantitative measure of the noise level in the signal. The data demonstrate that at both 23 °C and 90 °C the variation/noise level is very low and shows no systematic dependence on the flow rate. Still it appears as if the noise level is slightly but systematically lower for the 90 °C tests compared to the 23 °C tests.
Effect of Bubbles on Reference Electrode / Overpotential Measurements
Figure 3.4 shows the measured overpotentials for hydrogen evolution and oxygen evolution obtained using two separate reference electrodes as outlined in Fig. 3.2. In addition to different temperatures and flow rates in the main hydraulic circuit, two different flow rates in the reference electrode circuit were applied, one with no flow (0 mL min⁻¹), the other with a flow rate of 1.5 mL min⁻¹.
The overpotentials are calculated relative to the thermodynamic potentials of hydrogen and oxygen evolution. As two separate reference electrodes are used, the relation Ucell = Urev + ηH2 + ηO2 no longer applies, as it does when one common reference electrode is used. Here Urev is the minimum thermodynamic potential for water electrolysis and equals 1.23 V at room temperature and 1.17 V at 90 °C. The data are presented as a function of time in order to focus on the fluctuations in the measured potentials. It is emphasized that the purpose of the experiments is solely to investigate how bubbles influence the noise level in reference electrode measurements and not general performance of the electrodes/cell. It is clearly seen that the presence of electrolyte flow in the reference electrode circuit generally leads to stable measurements. Without flow, the Luggin capillaries become blocked intermittently on the two sides and disturb the measurements, whereas flow in the reference electrode circuit stabilises them.
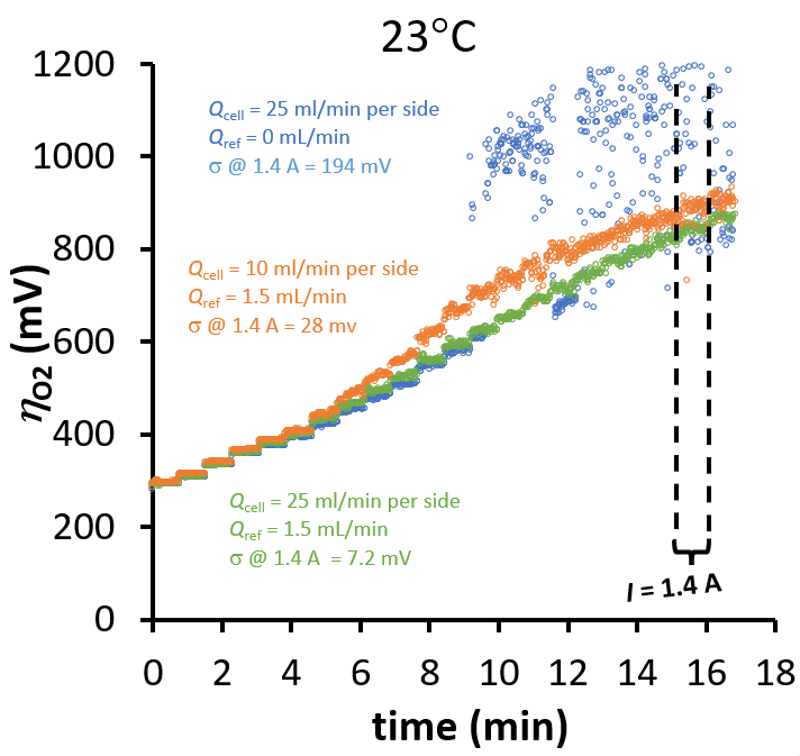
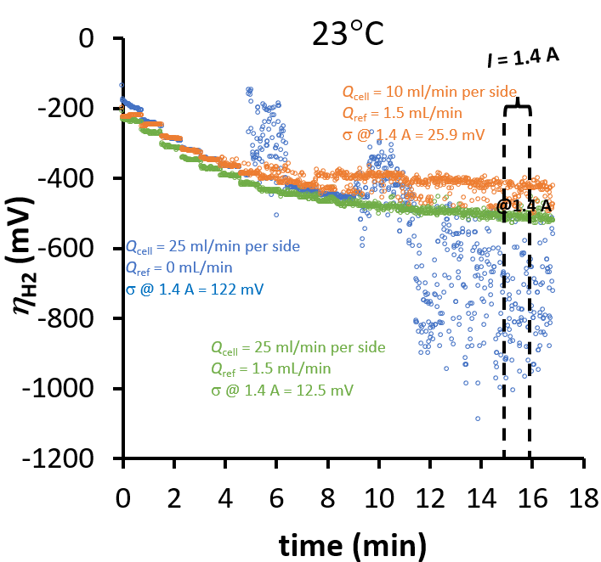
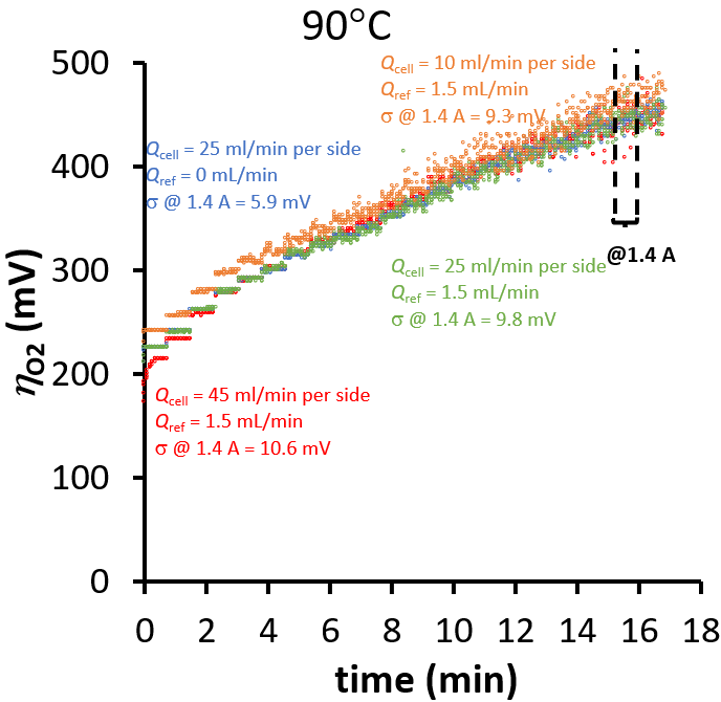

Figure 3.4 – Measured oxygen and hydrogen overpotentials obtained using two separate Hg/HgO reference electrode under different electrolyte flow conditions and temperatures. Measurements were performed both with and without electrolyte flow through the reference electrode circuit.
Performance tests
The preceding sections have primarily focused on the limitations of the 1 cm² M-cell in terms of the effects of bubbles on reference electrode measurements. The present section instead illustrates the electrochemical performance that can be obtained with the setup.
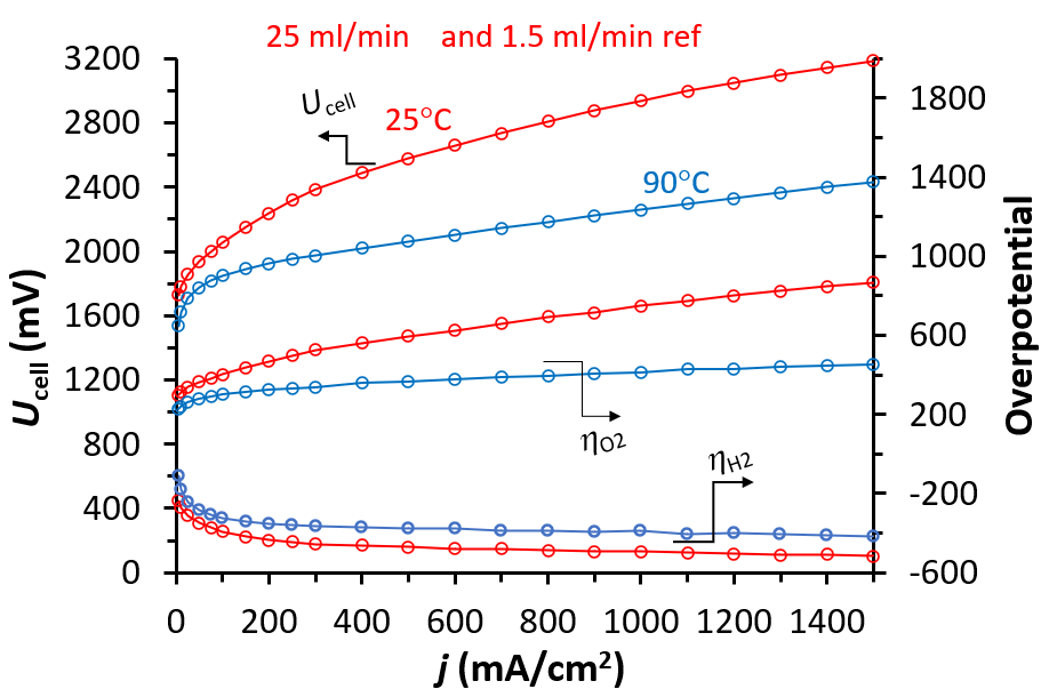
Using the experimental configuration shown in Fig. 3.2, polarisation curves together with hydrogen and oxygen overpotentials were measured by recording the potentials as a function of time at a series of applied currents. Each current step was held for 45 s, and the reported values were calculated as the average of the final 22 s of each step. The present data compare operation at room temperature (RT, 23 °C) and 90 °C, and the results are shown in Fig. 3.5.
Overall, the polarisation curves at room temperature and 90 °C show similar shapes, but the total cell potential at 90 °C is approximately 700 mV lower than the RT data at the highest currents (1500 mA cm⁻²), as expected from the improved electrochemical kinetics and electrolyte transport at elevated temperature. When the overpotentials are separated into contributions from the hydrogen evolution reaction and the oxygen evolution reaction, it becomes clear that the main improvement comes from the oxygen side. The hydrogen overpotential remains relatively similar at room temperature and 90 °C, whereas the oxygen overpotential decreases by approximately 300 mV at 1500 mA cm⁻² upon heating. This appears somewhat contradictory to the similar plots shown in Fig. 2.6 where it was seen that Ucell at RT are not the same, while data at 90 °C are about the same. However, for alkaline water electrolysis it is known that impurities in the electrolyte and previous operation of the electrodes have a large influence on the performance/polarisation curve. As the present tests focus on demonstrating the capabilities of the M-cell, the age of the electrolyte, reuse of electrodes, etc. were not controlled, and it is anticipated that the apparently contradictory results arise from non-systematic reuse of electrodes and electrolytes. Additionally, ηH2 and ηO2 cannot be directly compared because the use of two independent reference electrodes in tests of Fig. 3.5 (Ucell ≠ Urev + ηH2 + ηO2) compared to tests of Fig. 2.6 (Ucell = Urev + ηH2 + ηO2).
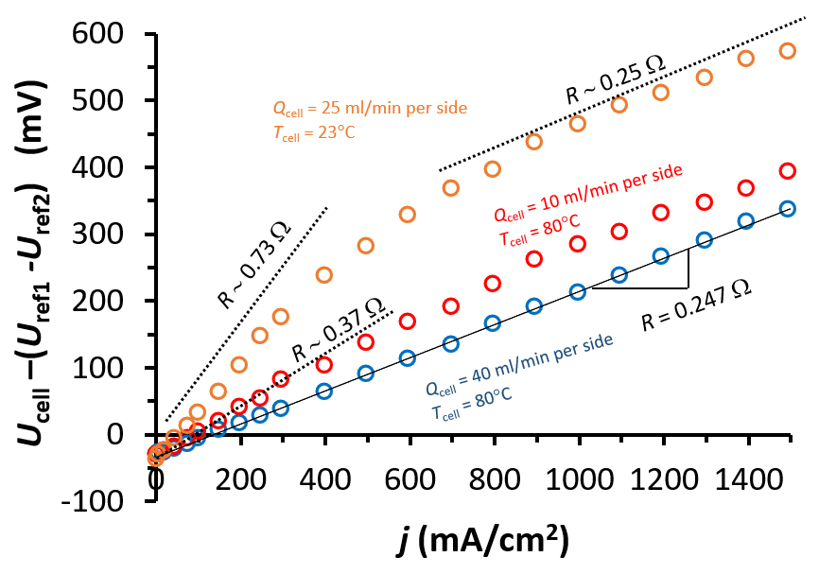
Figure 3.6 – Measured voltage difference between the cell voltage (Ucell) and the difference between the two reference electrodes ( Uref1 – Uref2 ). The magnitude is a proxy for the sum of the resistance of the separator and current density variable contributions from the electrolyte and bubbles.
Internal consistency of reference electrode measurement points
This section is related to discussing the accuracy and positional consistency of the measurement points defined by the Luggin capillaries. Two reference electrodes are connected to individual Luggin capillaries with measurement points located at the middle of the electrodes (perpendicular to the 1.7 mm thick electrode) as defined by the geometries of the gaskets as shown in Fig. 3.1 and 3.2. This means that the reference electrodes are separated by the Zirfon 220 separator and a reference electrode distance (~1.0 mm including the Zirfon thickness). For that reason Ucell – (Uref1 – Uref2 ) = Ucell – (ηO2 – ηH2 + Urev ) will measure the sum of the resistance of the separator and the resistance of the electrolyte inside the tortious electrode plus any additional bubble resistance.
Figure 3.6 shows Ucell – (Uref1 – Uref2 ) as a function of current density for tests with different cell flow rates and temperatures. For Zirfon UTP220 separator the expected resistances are approximately 0.1Ω (0.1Ωcm2) and 0.05 Ω (0.05 Ωcm2) at RT and 80°C.[2] While resistance from 1 mm electrolyte inside the electrode (not considering tortuosity) is 0.17 Ω and 0.073 Ω at RT and 80°C. Thus the expected minimum resistance measured is expected to be 0.27 Ω and 0.123 Ω at RT and 80°C, respectively.
For the test with temperature of 80°C and highest flowrate (40 mL min⁻¹), it is seen that that the curve has a small offset of about -30 mV, which is due to the small differences of the reference electrodes that were not calibrated prior to the experiment. Besides this the curve is almost fully linear with a slope of 0.247 Ω which is slightly higher than the minimum calculated value of 0.123 Ω. The difference probably being due to both a combination of bubble resistance and electrode/electrolyte tortuosity. When flow rate is lower at 10 mL min⁻¹ (but at same temperature) it is seen that the curve becomes a little non-linear with an initial resistance of about 0.37 Ω that is higher than 0.247 Ω and in agreement with higher bubble resistance due to lower flow rate. For the RT experiment where the flow rate is 25 mL min⁻¹, a clear non-linear trend is seen, with and initial resistance of 0.73 Ω that flattens out to a value of about 0.25 Ω. Again the value of 0.73 Ω is much higher than the minimum expected value of 0.27 Ω from separator electrolyte and is probably a combination of both increased bubble resistance and tortuosity of the electrode. The origin of the non-linear increase is not fully clear, but most likely related to some dynamic bubble resistance. I.e. as the bubble formation increases the bubbles takes out such a large volume that resistance cannot increase any further. Nonetheless, the main point here is to demonstrate that the position of Luggin capillaries are well defined down to sub millimetre and depending on the gasket configuration can be used for studying either separator resistance or bubble dynamics.
Demonstration of an application test
Addition of iron or presence of iron from e.g. 316L stainless steel in the KOH electrolyte is well-known to increase the performance/efficiency of alkaline electrolysers.[3] The following demonstrates how the 1 cm² M-cell with reference electrodes can be used for understanding the effect of iron on the performance in more detail. The experimental setup is the same as the one described in Figure 3.1 and 3.2 with two independent reference electrodes, however, the setup described in Figure 1.1 and 1.2, and Figure 2.1 and 2.2 could equally well be used.
Figure 3.7 shows the cell potential, Ucell – (ηO2 – ηH2 + Urev ), ηO2 and ηH2 as function of time with cell flow rates of 10 mL min⁻¹ and 1.5 mL min⁻¹ through the reference electrode circuit. Temperature inside the cell is 80 °C. Initially there is no current/voltage applied to the cell, but within the first minute the 1000 mA is applied and Ucell increases to an almost constant value within the first 5 minutes of the test. Equally, ηH2 and ηO2 reach their steady-state values within the first 5 min, but with ηH2 reacting slower. After about 18 min Fe2(SO4)3 is added to the common electrolyte in an amount corresponding to 1 mM. Ucell drops instantaneously and reaches an almost steady-state value after about 6 minutes, and about 300 mV lower than before addition of iron and demonstrates the effect of iron addition. However, more importantly, it is seen that the ηO2 drops almost to the steady state value within 30–45 seconds and is almost 200 mV lower than before. Nonetheless, also becomes less negative (about 100 mV) but the steady state value is first reached after several minutes and demonstrates that the surface/catalysts restructuring on the hydrogen side is much slower than on the oxygen side.
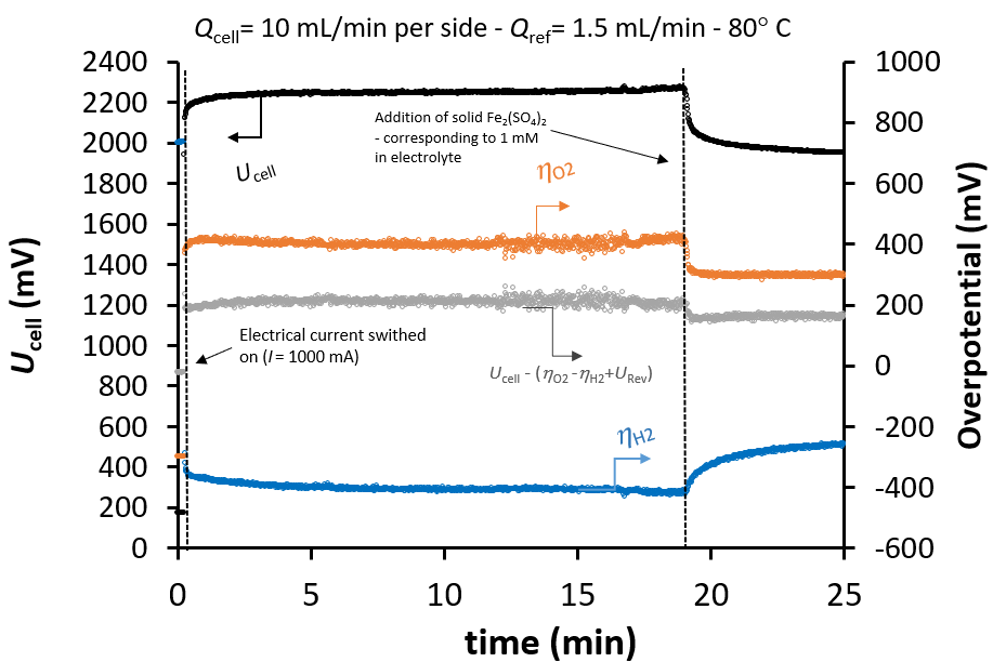
Figure 3.7 – Cell potential, Ucell , and overpotentials for hydrogen evolution, ηH2 , and oxygen evolution, ηO2 , as a function of time at 90°C and a constant current of 1000 mA (1000 mA cm⁻²). Current is switched on within the first minute of the experiment. After about 19 min Fe2(SO4)3 is added to the common 6 M KOH electrolyte, corresponding to a 1 mM concentration.
Besides this also the Ucell – ( ηO2 – ηH2 + Urev ) is plotted. As discussed in previous section it is a measure of the combined separator resistance and electrolyte resistance a certain distance (~ 0.5 mm on each side) into the electrode. Initially the value is constant and about 200 mV, once the iron is added there is a small drop of about 50 mV. As the separator resistance is not expected to change, it can be interpreted as that the improved catalytic performance moves the electrochemical reactions (OER, HER) closer towards the separator. As the reactions move closer the ohmic loss due to migration of ions will become smaller and explain the small drop in the value.
Together, this application test demonstrates the power of the M-cell, its Luggin capillaries and use of reference electrodes to increase understanding of
- Individual catalytic improvement of both ηO2 and ηH2 when iron is added
- The dynamics of the surface/catalysts restructuring when iron is added and in particular the difference between the two sides
- Understanding of the effect of the catalysts and impact on the reaction (HER/OER) sites on the performance
how that noise in potential measurements can originate both from bubbles formed at the electrode surfaces and from bubbles entering the Luggin capillary / reference electrode circuit. For some long term electrochemical testing stability over longer timescales (minutes to hours) is important.
References
[1] A Review of Specific Conductivities of Potassium Hydroxide Solutions for Various Concentrations and Temperatures
R.J. Gilliam, J.W. Graydon, D.W. Kirk, S.J. Thorpe, International Journal of Hydrogen Energy, 32 (2007) 359–364
[2] Technical Data Sheet ZIRFON UTP 220
[3] Demnitz, M., Lamas, Y. M., Barros, R. L. G., den Bouter, A. D. L., van der Schaaf, J., & de Groot, M. T. (2024). Effect of iron addition to the electrolyte on alkaline water electrolysis performance. Iscience, 27(1).
Interested? We’d like to hear from you!
Don’t hesitate to contact us with any kind of inquiries at
sales@redox-flow.com or call Mikkel Kongsfelt at +45-3126-2040