
Whitepaper VII
1 cm² M-cell – Flow battery tests
Mikkel Kongsfelt
Introduction
Flow battery research and development is largely driven by optimisation of electrodes, electrolytes and flow-cell geometry. In particular for testing of new redox active molecules, only small amounts/volumes are available and for this reason smaller active area are needed. Here the 1 cm2 M-cell (https://redox-flow.com/product/m-cell-full-cell-2/), is a unique multipurpose electrochemical test cell for advanced electrochemical investigations.. Additionally, in a standard laboratory flow-battery setup, only the electrical current and the cell potential are measured. Although these two parameters alone determine the overall performance, it is from an R&D perspective desirable to understand how the individual parts and components contribute to the overall energy losses (anolyte/catholyte redox potentials and overpotentials). This white paper demonstrates how these losses can be mapped out experimentally. The demonstration focuses on battery testing but the M-cell can, however, equally be used for many other purposes, such as half-cell cycling, cyclic voltammetry and studies on low electrolyte volumes. The tests are performed with 2,7-anthraquinone disulfonate (AQDS) and ferrocyanide ([Fe(CN)6]4−) as the redox-active molecules. The motivation of this white paper is not so much to demonstrate optimal performance of the chosen chemistry, but rather to demonstrate the capabilities and possibilities of the combined M-cell and OCV-cell setup, which is unique in enabling studies on small electrolyte volumes with full mapping of all relevant potentials.
Definitions of energy levels
Fig. 1 shows a general representation of the energy levels in a flow battery (or any other reversible electrochemical flow system). In the figure, the blue scale represents absolute energy levels with respect to, e.g., the standard hydrogen electrode (SHE). On the absolute scale, the abbreviations are:
- εCC– and εCC+: The potential on the negative and positive side current collectors
- ε– and ε+: The (redox) potential of the liquid on the negative and positive side – note that it is variable and depends on the state-of-charge and is described by the Nernst equation
- εref: The potential of (a) reference electrode(s) in the setup
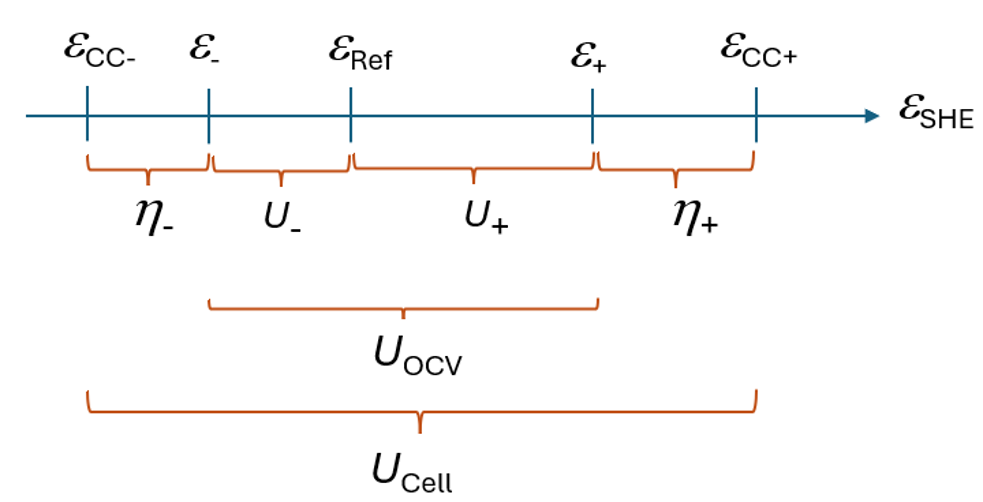
While the upper (blue) potentials are absolute energy levels, the lower (orange) parts show the measurable voltages. Here
- η– and η+ : The overpotentials for charging (discharging) of the negative and positive side liquids
- U– and U+ : Measured potentials with respect to a reference electrode to determine the liquid (redox) potentials of the negative (ε–) and positive side (ε+)
- UOCV : Potential measured in an OCV cell
- Ucell : The potential measured on the electrochemical cell by battery tester or potentiostat
The overpotentials and the electrolyte redox potentials are the most important parameters for mapping out internal resistive losses. There are multiple experimental approaches[1],[2],[3] for a complete mapping of η– , η+ , ε– , and ε+ .
Experimental setup
All experiments were performed using commercially available electrochemical research equipment from www.redox-flow.com. The electrochemical cell used in this study was the 1 cm² M-cell, a multipurpose electrochemical test cell designed for advanced electrochemical investigations and flexible reference electrode configurations (Fig. 2):
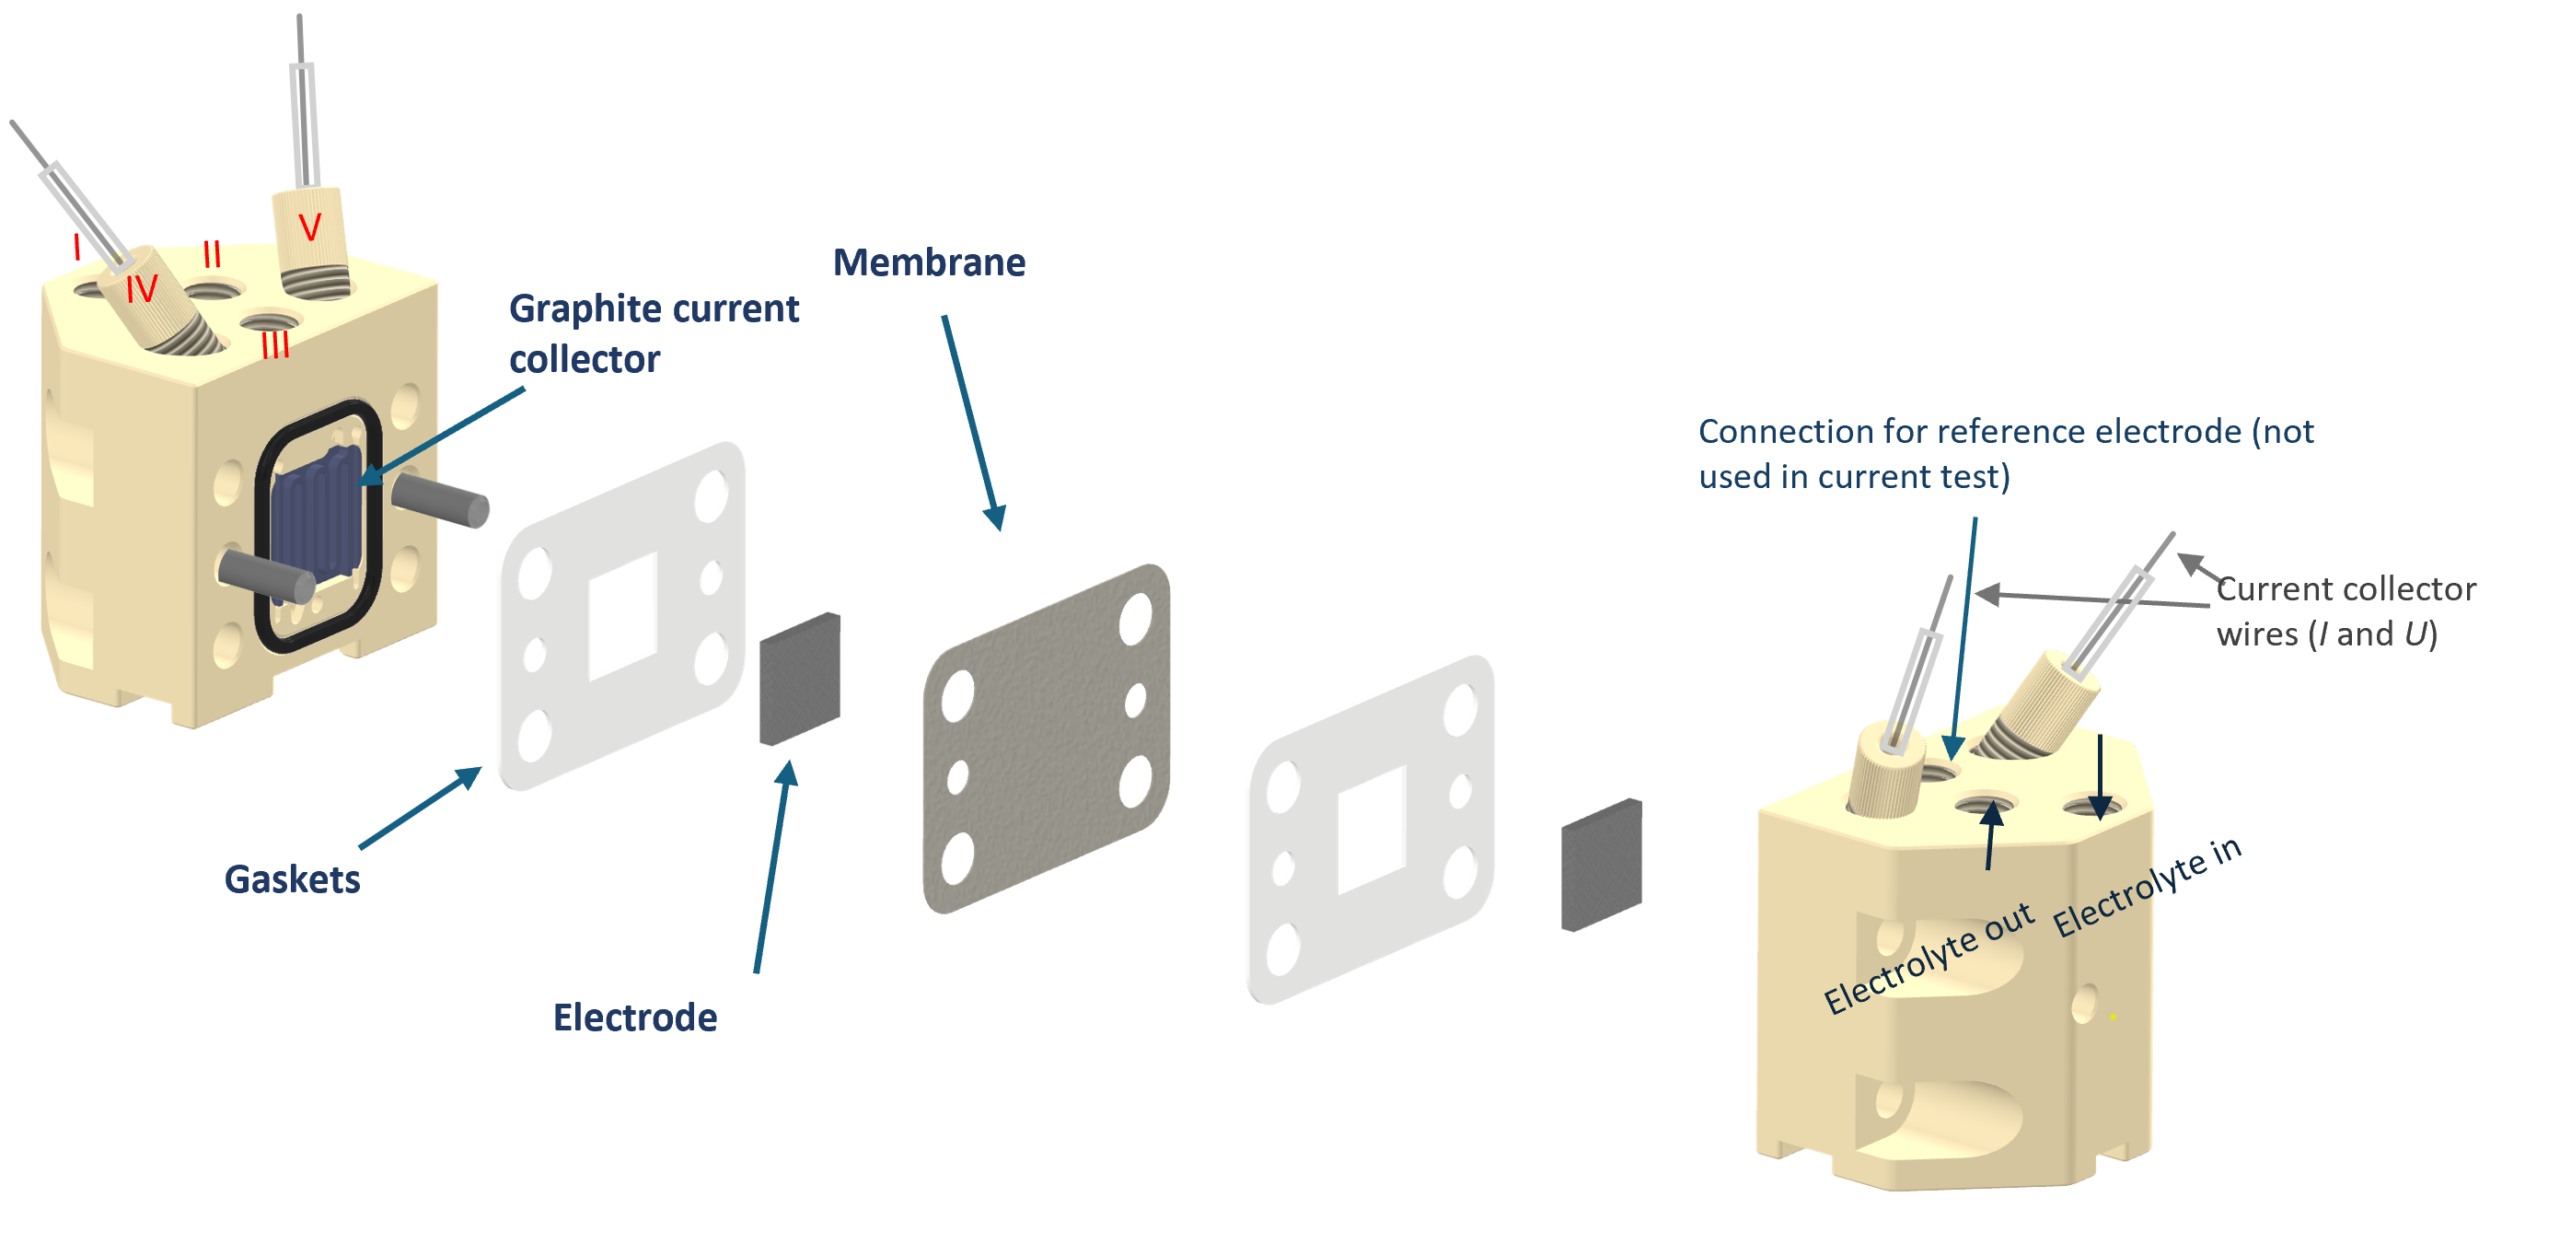
- Membrane: 20 µm E620 membrane from Fumatech
- Electrodes: Thermally treated AvCarb carbon felt, 4.7 mm thickness at 30 % compression (3.3 mm compressed thickness)
- Current collectors: Graphite based (standard for flow batteries)
- Flow rate: 20 mL/min per side
Additionally, Redox-Flow has developed a unique OCV cell (see the separate white paper Measurement of Overpotentials and Liquid Potentials in Flow Batteries1 for a detailed performance evaluation) that enables an additional chamber to be mounted on the OCV cell. This additional chamber can be used as an ‘internal’ reference electrode in the OCV cell, replacing the external reference electrodes used in conventional setups.
Fig. 3 shows a schematic representation of the setup. Red and blue lines refer to the electric and hydraulic circuits, respectively, while the black parts represent the units in the circuit. The overpotentials (η– and η+) are measured directly between the OCV cell and the electrochemical flow cell, while the redox potentials ( ε– , and ε+) are measured with respect to the redox solution in the central chamber through the voltages U– and U+. In the present white paper, the reference solution is a 50 %/50 % mixture of ferro-/ferricyanide (Zobell’s solution). Since the posolyte is ferrocyanide ([Fe(CN)6]4−), the reference chamber is placed on the outside of the positive side of the OCV cell (rather than in the centre, which can also be used) to minimise cross-over of contaminants into the reference solution. Throughout this white paper, all potentials are given with reference to the ferri-/ferrocyanide potential, and for this reason ε– = U– and ε+ = U+. The different chambers of the OCV cell are likewise separated by Fumatech E620 membranes.
The reference solution is circulated from an external third reservoir bottle by a peristaltic pump. It is noted that the same peristaltic pump (with three pump heads) is used for both the main cell and the reference chamber of the OCV cell, and that all channels are pumped at 20 mL/min.
In the present test, the electrolyte compositions were:
- Negolyte (120 mAh for 1.5 electron transfer1): 30 mL – 0.1 M Na2AQDS (2,7-anthraquinone disulfonate) + 0.25 M Na2SO4
- Posolyte (402 mAh): 50 mL – 0.3 M K4[Fe(CN)6] + 0.25 M Na2SO4
- Reference solution: 40 mL – 0.15 M K4[Fe(CN)6] + 0.15 M K3[Fe(CN)6] + 0.20 M Na2SO4
The posolyte capacity (402 mAh) is thus in clear excess of the negolyte capacity (120 mAh), ensuring that the posolyte is not the capacity-limiting side. Hence, it is the AQDS negolyte that is being probed in terms of capacity fade.
Additionally, the test setup comprised a 6 V/5 A battery tester equipped with an auxiliary (AUX) measurement unit that records the potentials from the OCV cell (overpotentials and redox potentials). All voltage and current data were recorded with a time resolution of 5 s for the battery cycling and 1 s for the polarisation curves.
Polarisation curve
The polarisation curve was obtained after the battery had been cycled for several days and was recorded at 50 % state-of-charge (SOC). It was obtained by applying a constant current and measuring the voltage for 10 s, using the average of the last 3 s as the voltage value in the polarisation curve. Currents were scanned from negative to positive values.
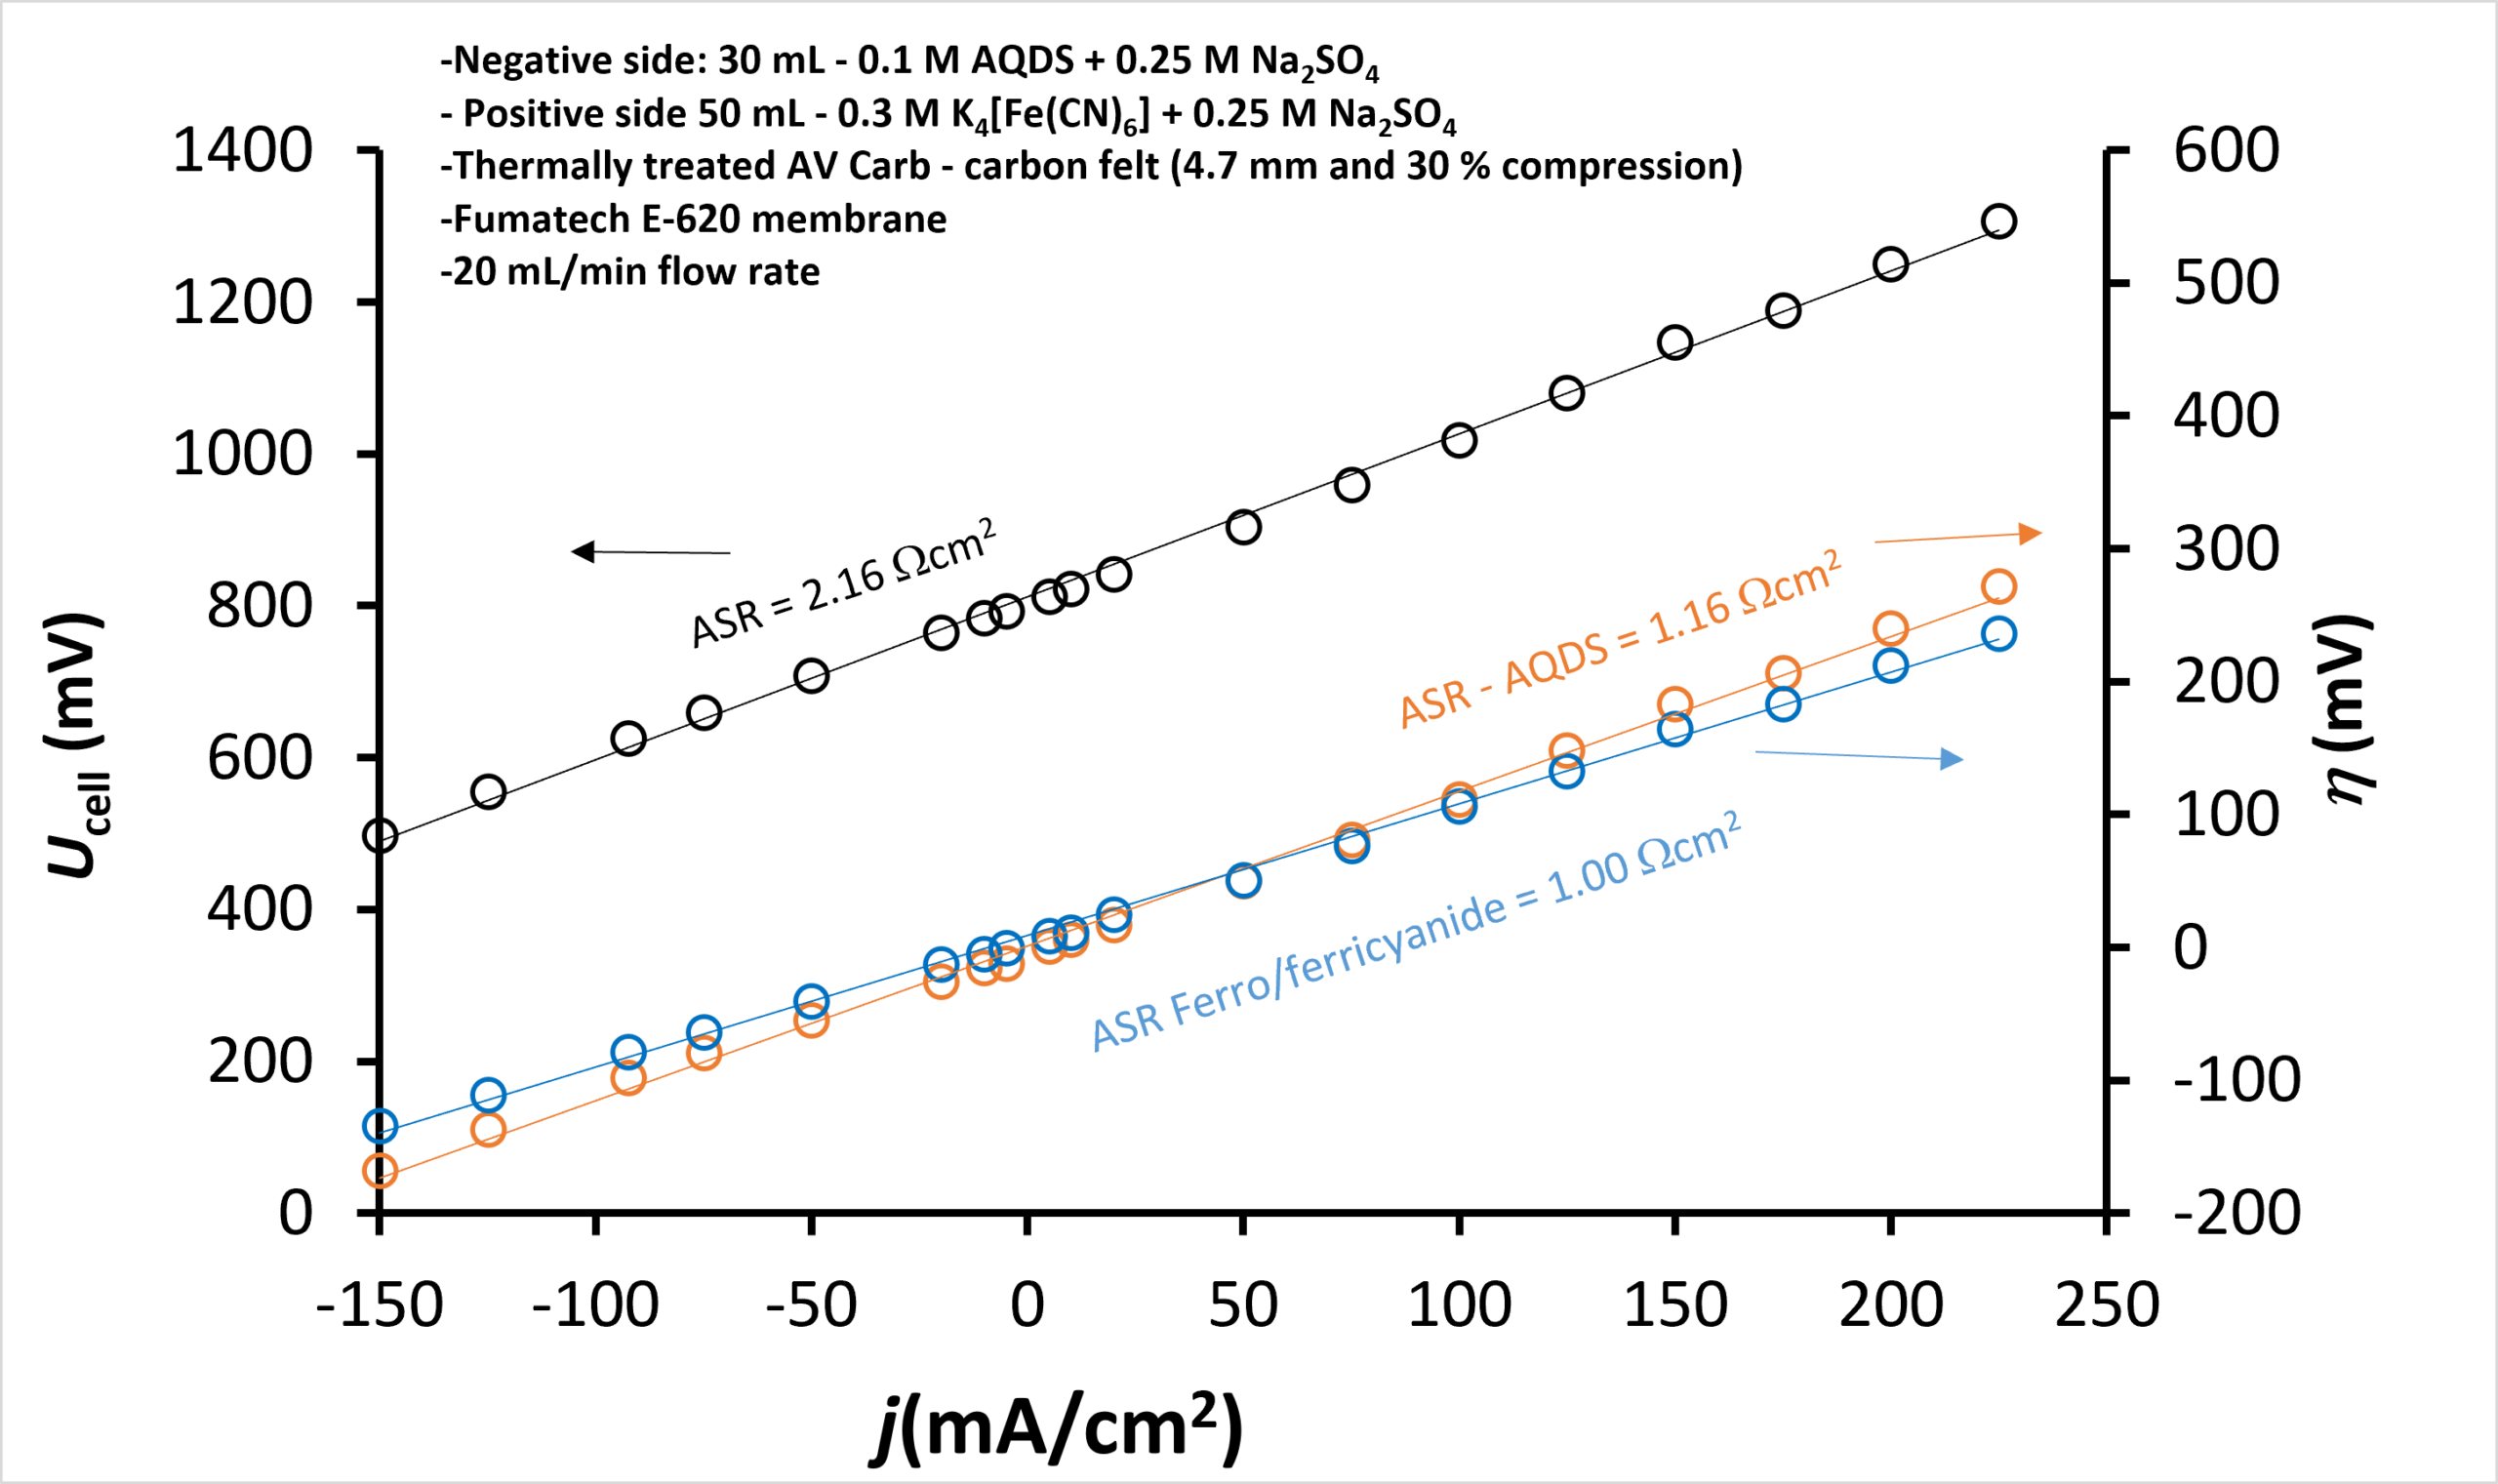
Fig. 4 shows the polarisation curve at 50 % SOC, from which a total area-specific resistance (ASR) of 2.16 Ω cm2 is found, in agreement with previously reported[4] values of 1.8 Ω cm2 to 2.2 Ω cm2 for a similar chemistry and electrode configuration but measured on a 25cm2 cell. By combining the M-cell with the OCV cell, it is also possible to measure the individual overpotentials, which are likewise shown in Fig. 4, where the ASR related to the positive side is 1.00 Ω cm2 and the ASR related to the negative side is 1.16 Ω cm2. The sum of the two ASRs adds up to the total ASR (2.16 Ω cm2) within 0.01 Ω cm2, despite the values being obtained from three independent voltage measurements. This not only underlines the robustness of the method, but also demonstrates that the combination of the M-cell and the OCV cell constitutes a powerful setup for the measurement and deconvolution of the individual overpotentials.
Battery cycling
To further demonstrate some of the potential R&D applications, a battery cycling test was conducted on the setup with the OCV cell with internal reference. The cycling protocol consisted of constant-current charging/discharging at 80 mA to voltage limits of 1150 mV and 475 mV, respectively, followed by constant-voltage charging/discharging until the current had decreased to 10 mA.
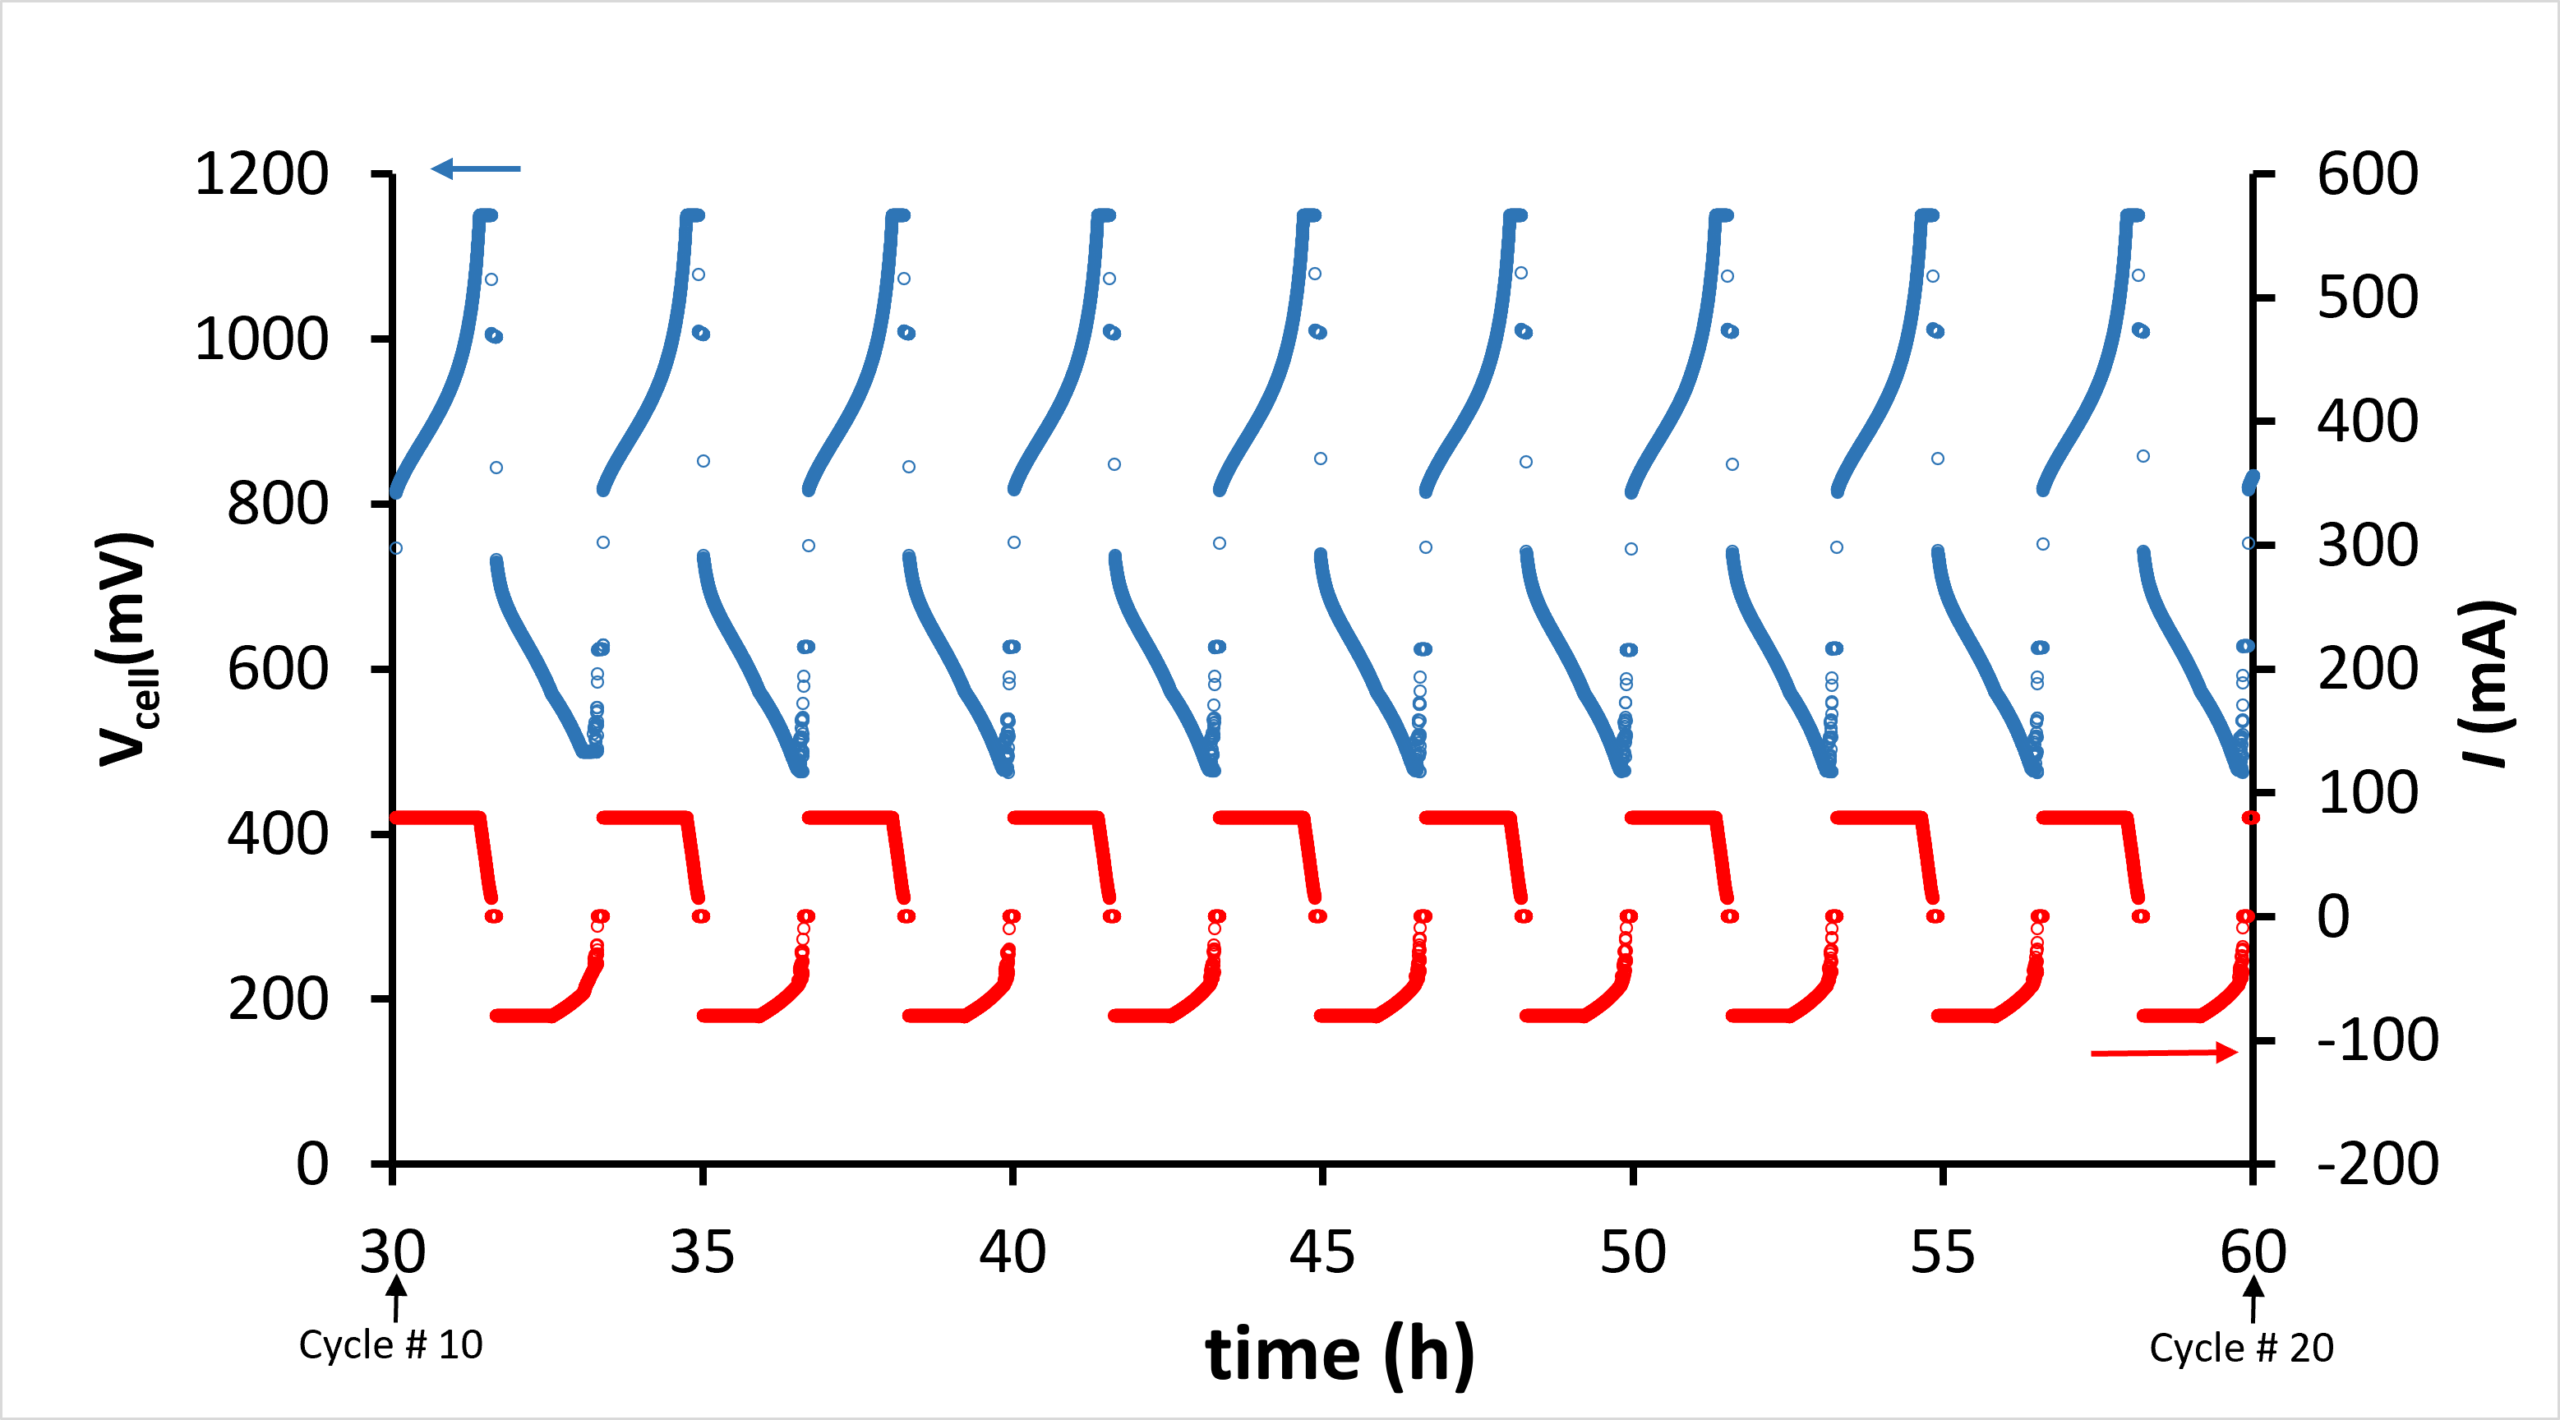
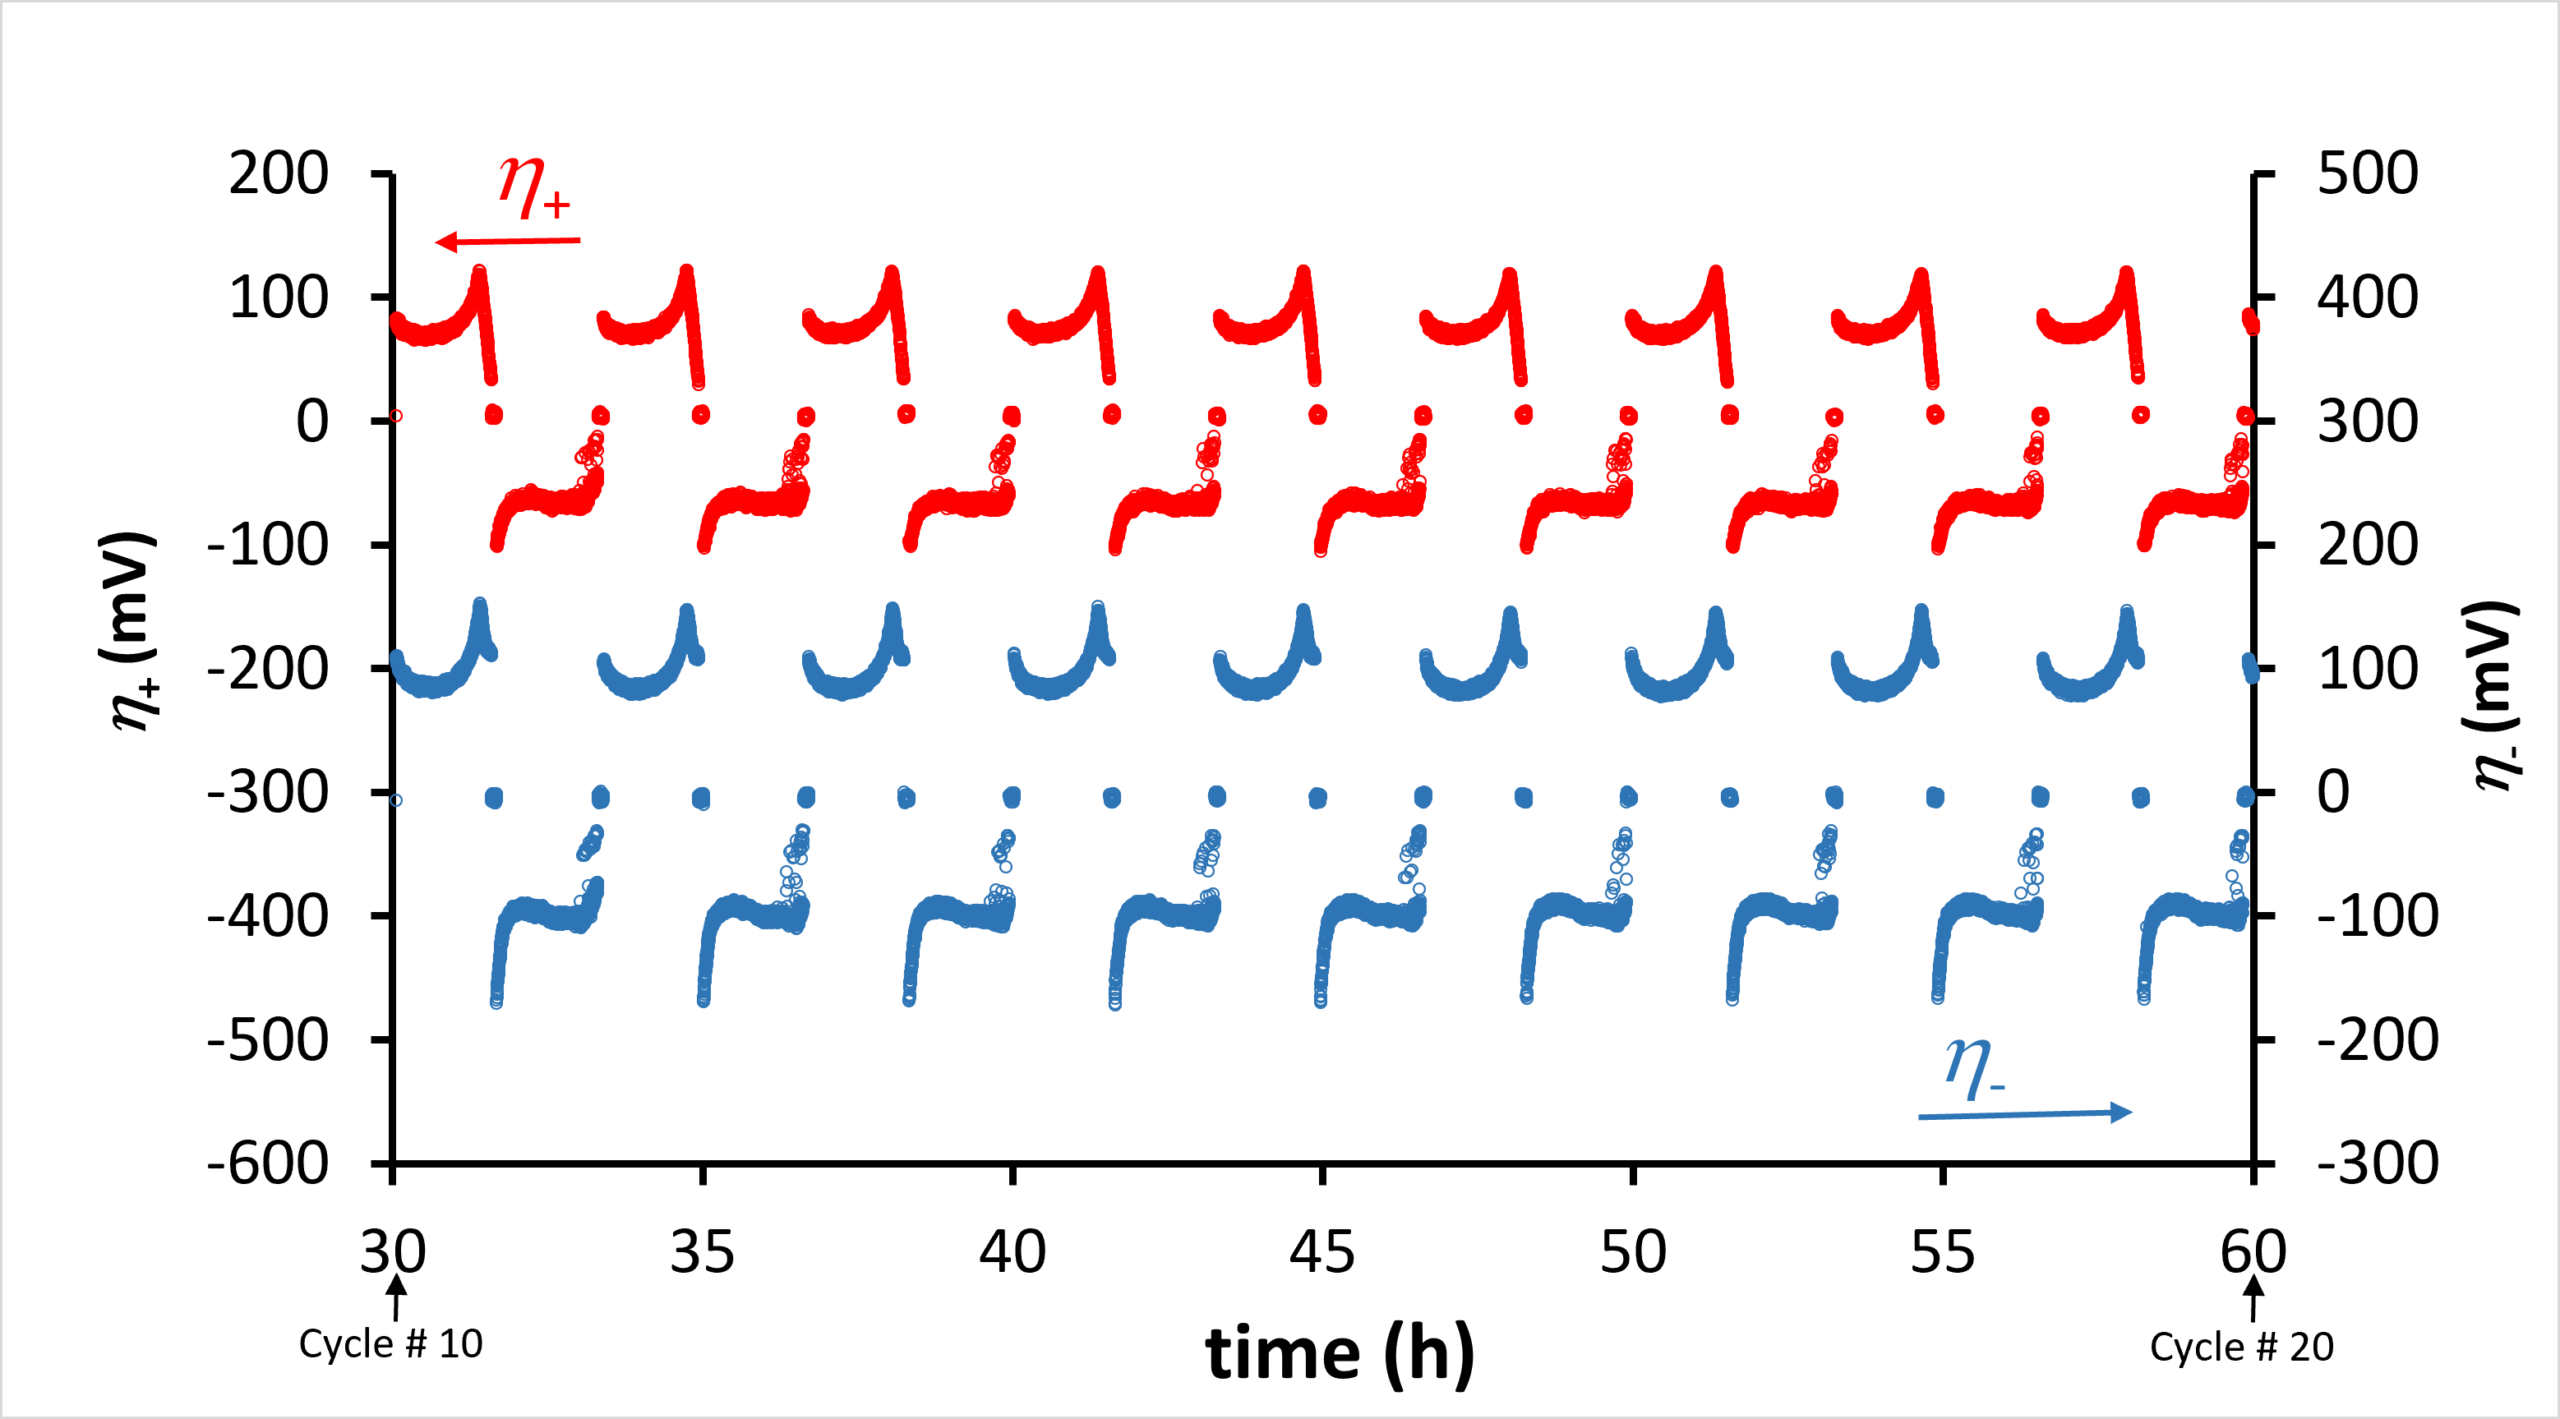
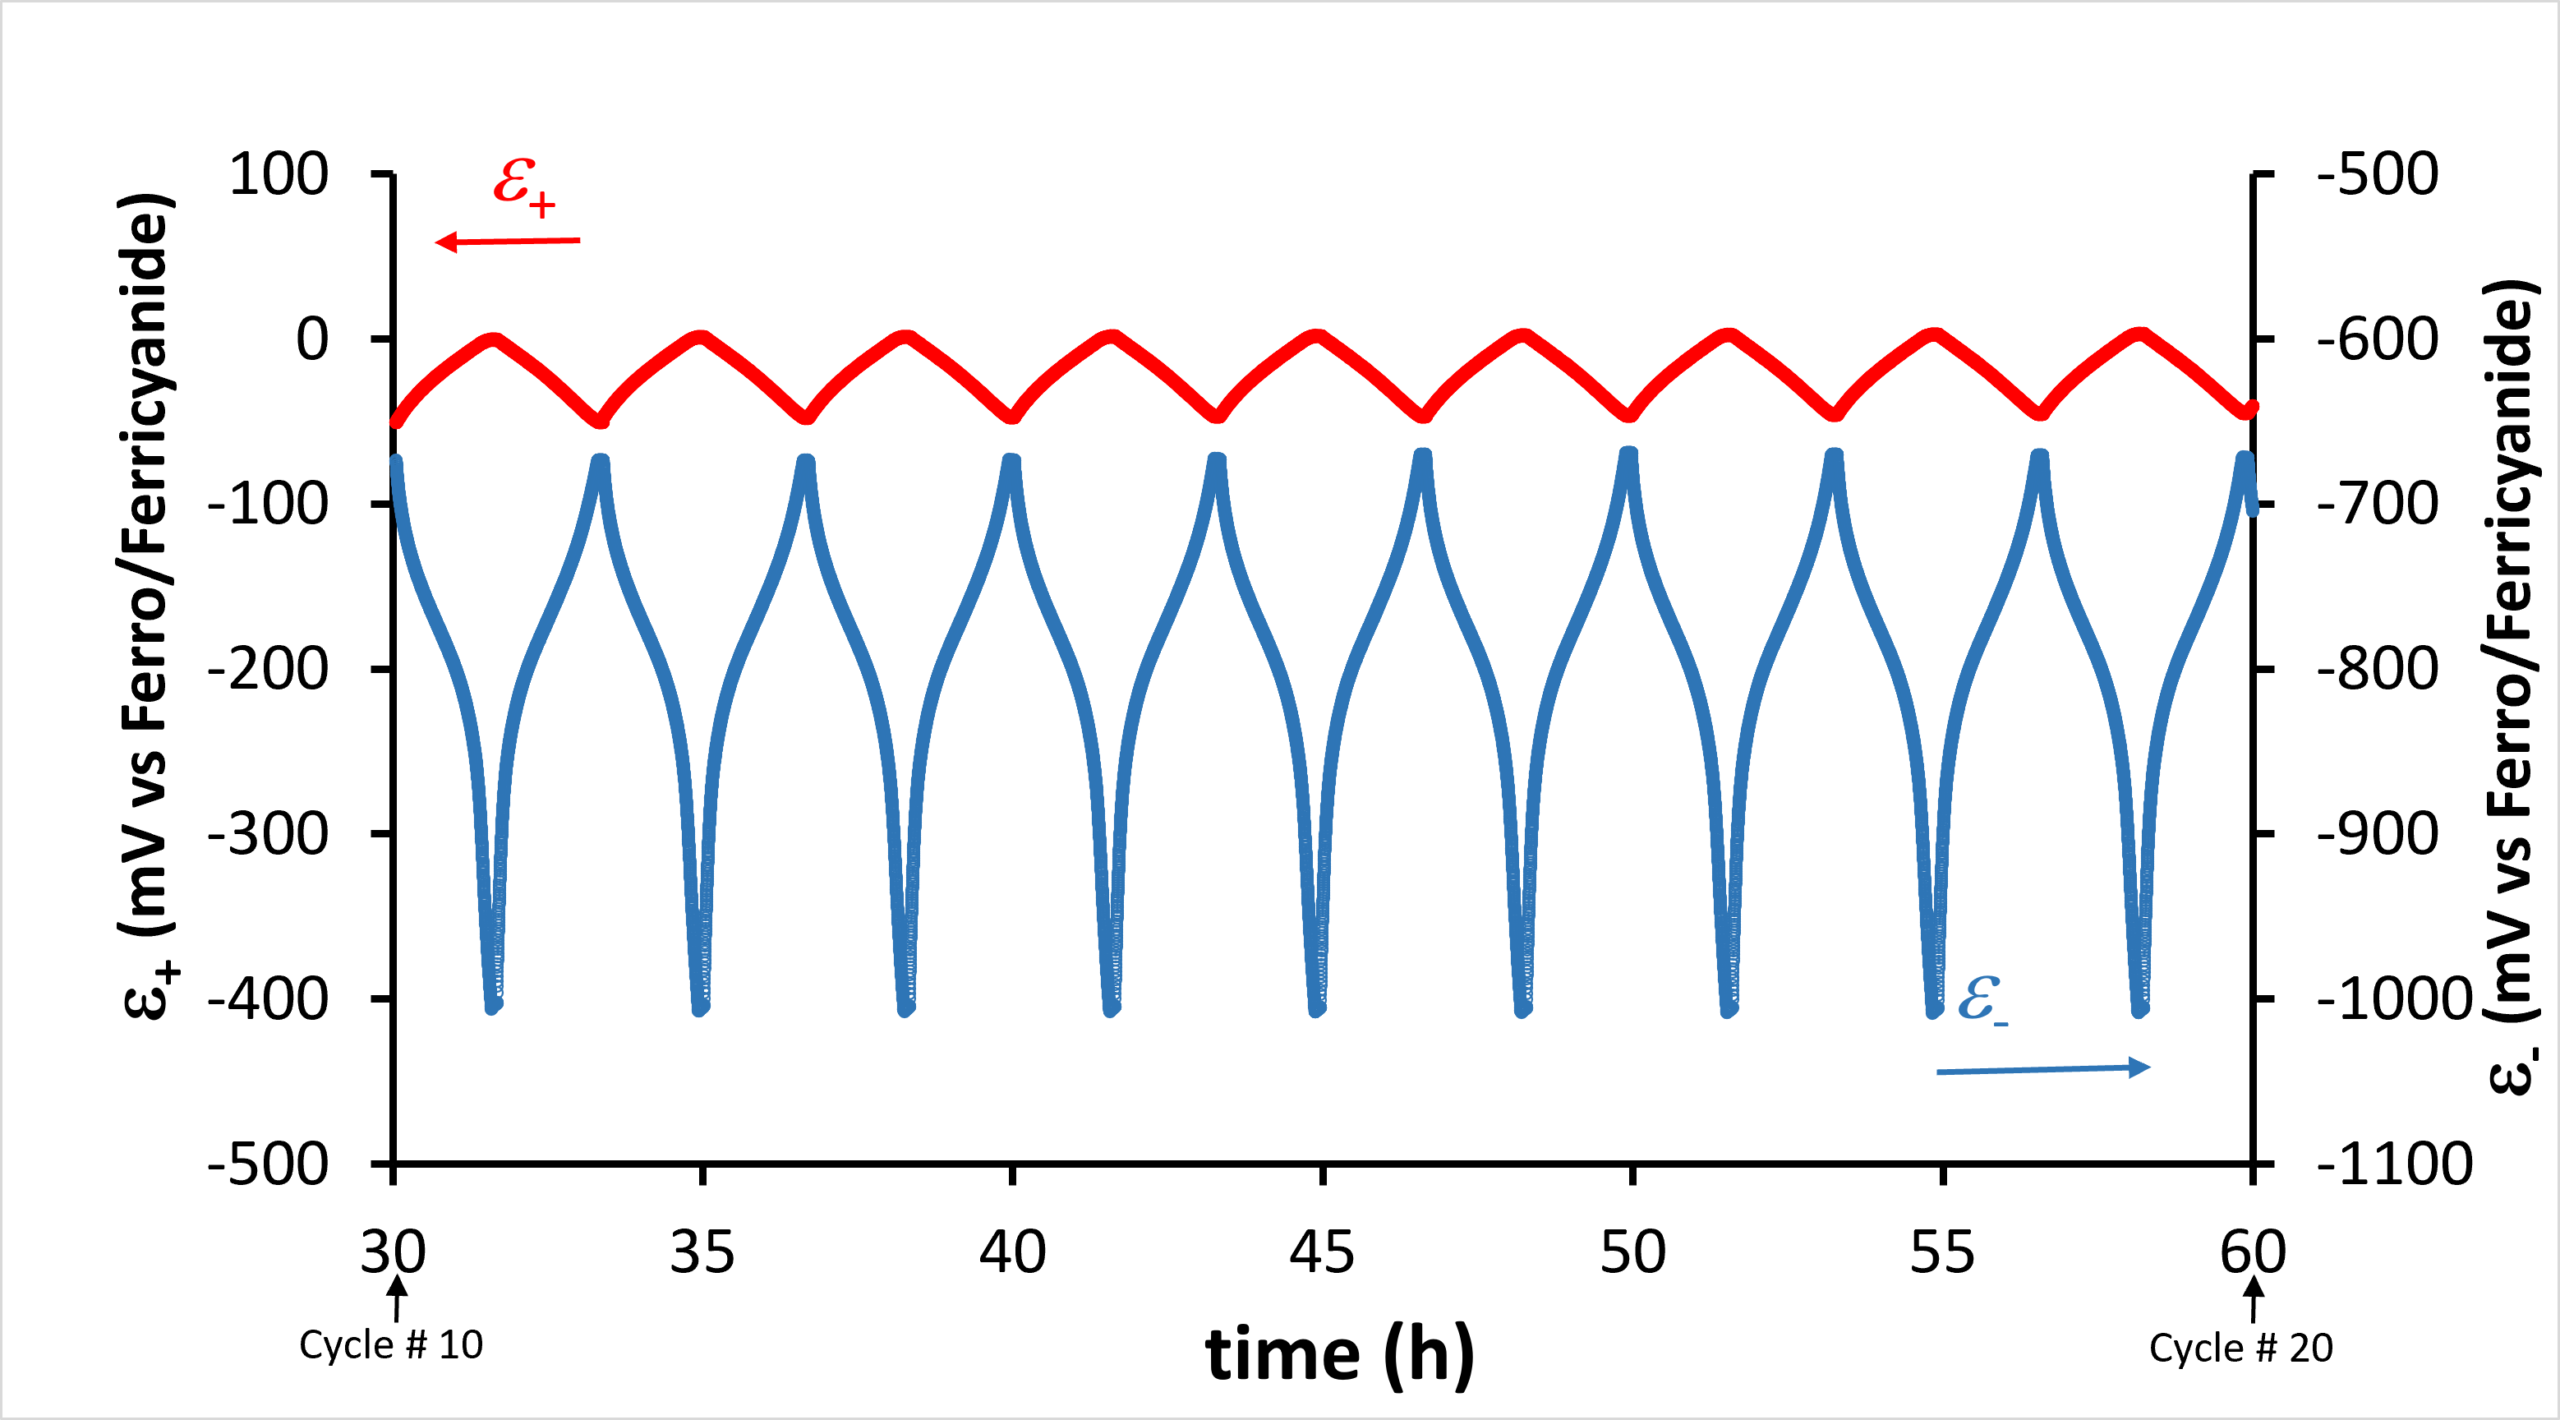
Fig. 5 shows representative time-series data of all measured parameters between cycle 10 and cycle 20. This includes the battery cell potential and electrical current (top panel), the overpotentials of the negative and positive side (middle panel), and the redox potentials of the negolyte and posolyte (lower panel in Fig. 5). In the following, the overpotential data will not be analysed further as this has already been discussed in the polarisation curve. The primary purpose of Fig. 5 is to illustrate the complete set of parameters that is measured when the OCV cell and the M-cell are combined. Within this interval of early cycles, the curves are stable and reproducible from cycle to cycle, while their evolution over longer time scales is analysed in the following.
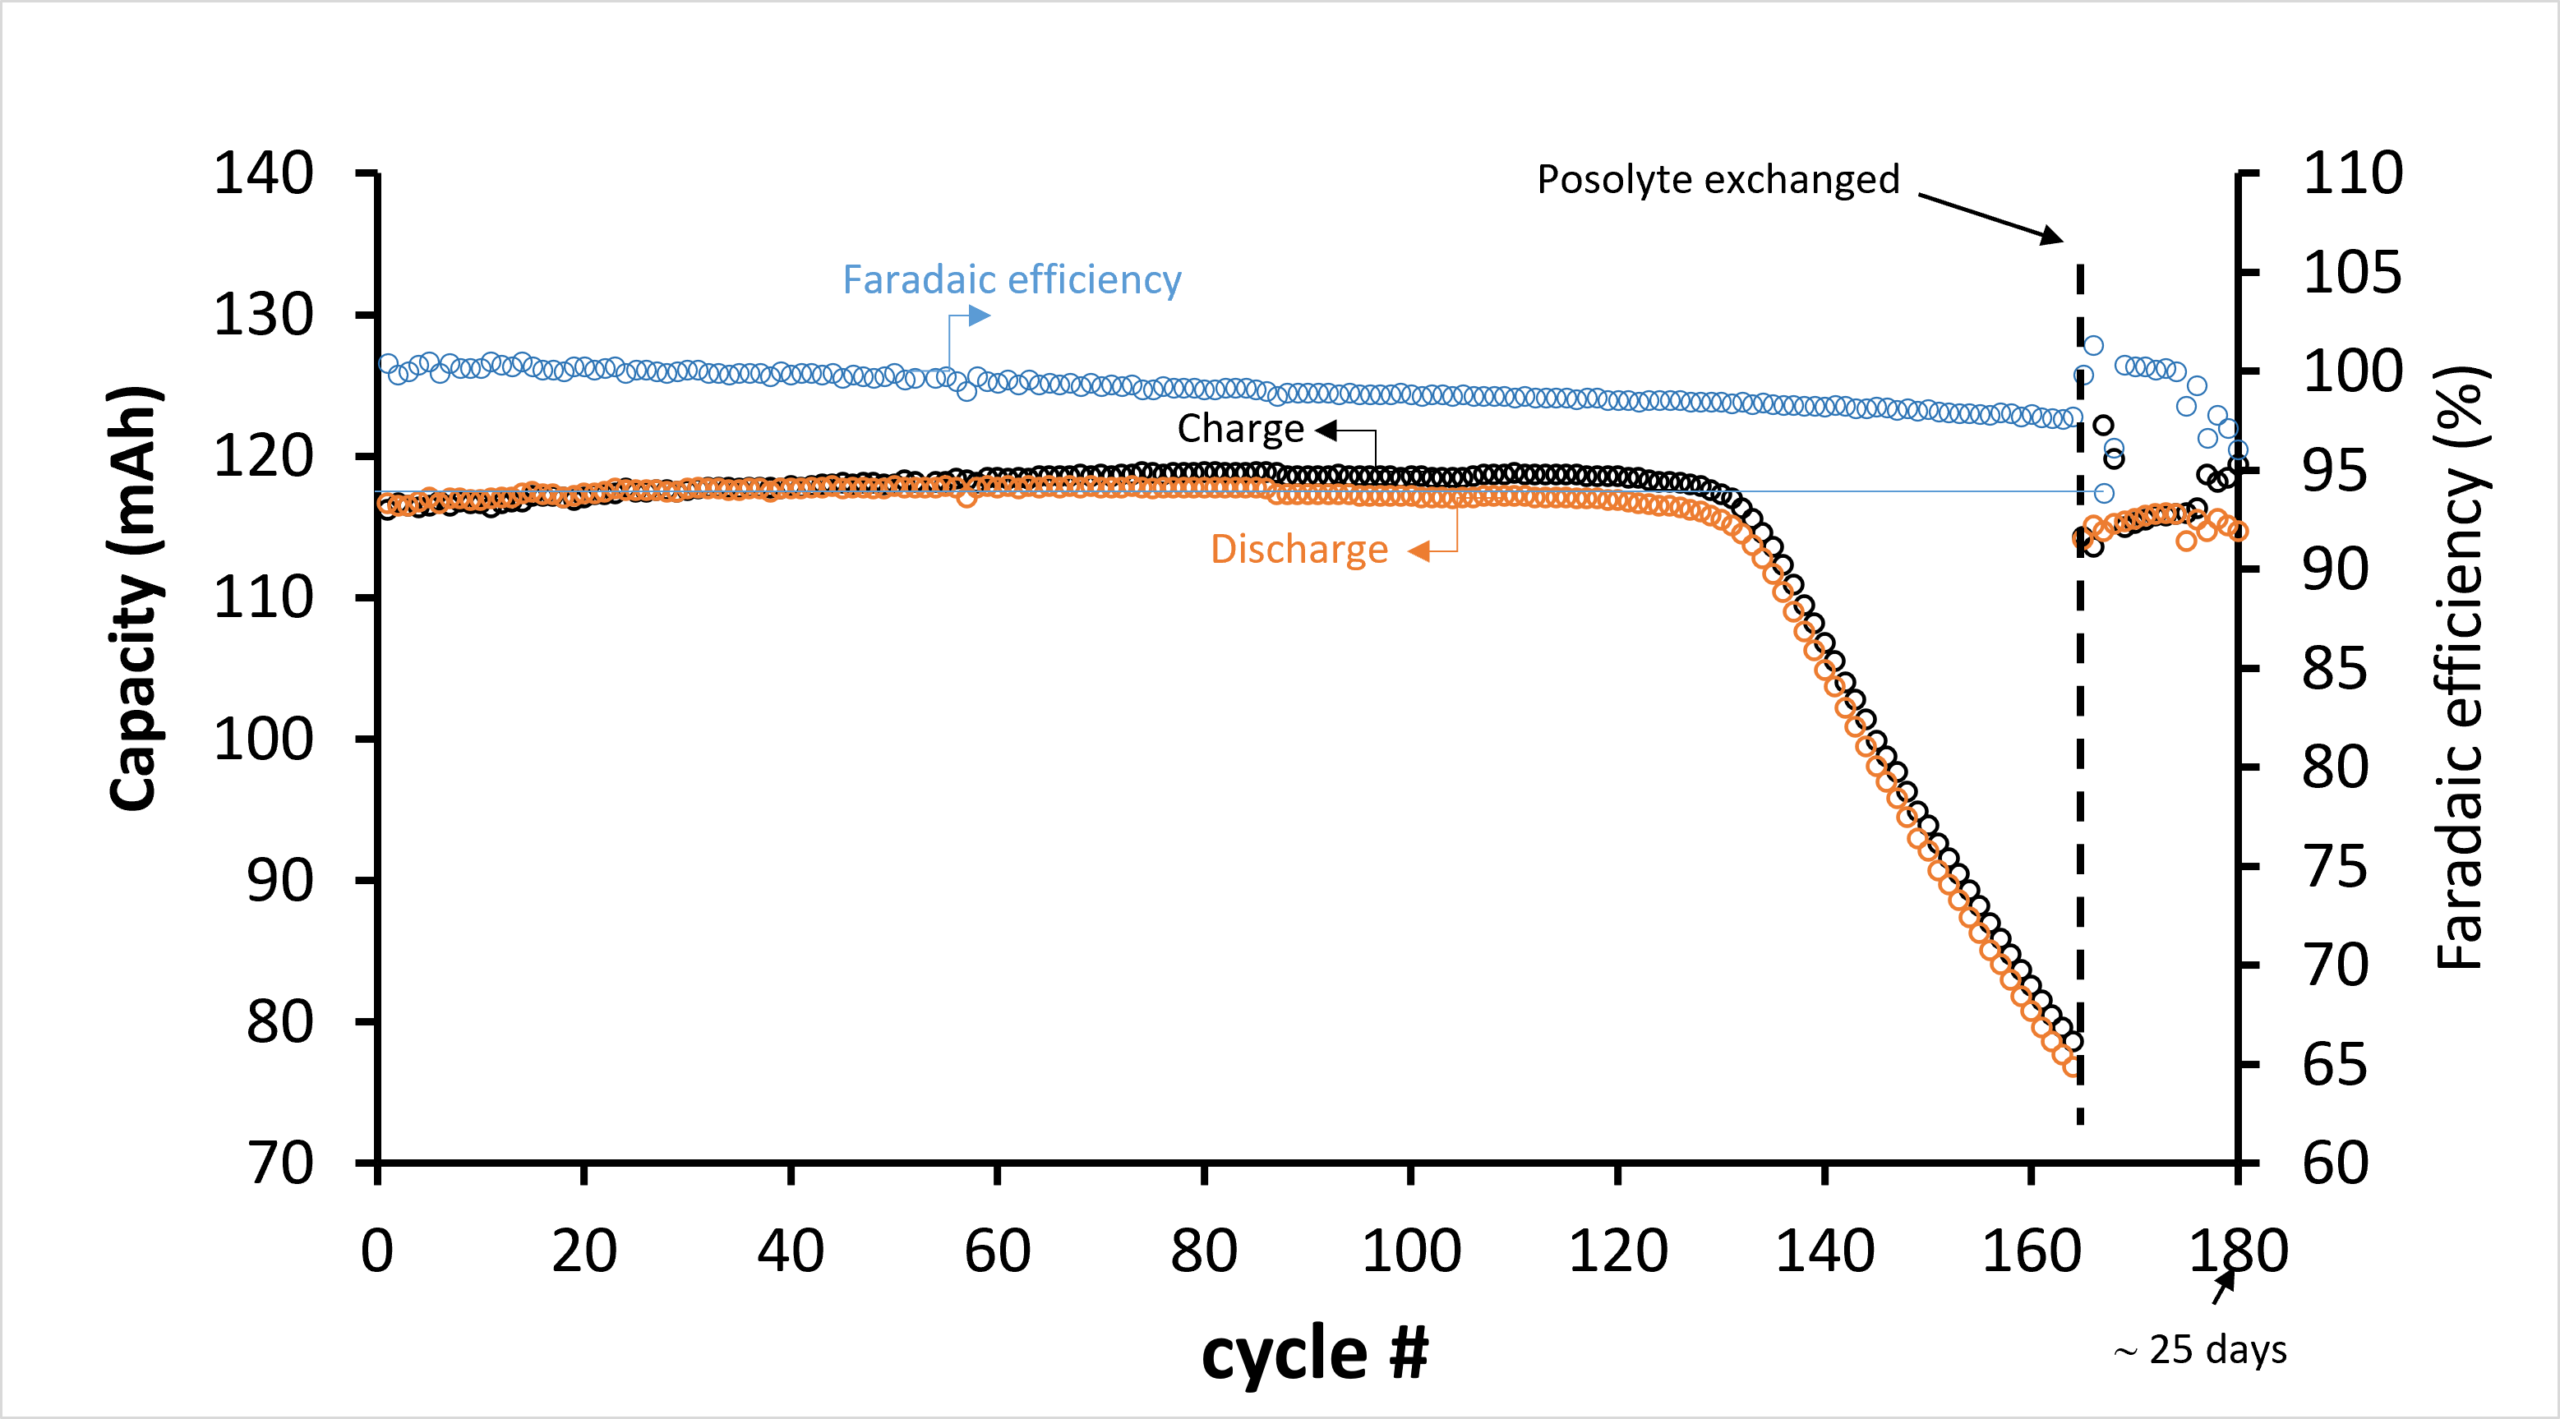
Battery cycling data are typically represented through the capacity and the faradaic efficiency, as shown in Fig. 6. The figure shows data from cycle 1 to cycle 180, recorded over a period of approximately 25 days, i.e., a full cycle takes approximately 3.3 hours. The initial capacity (116.2 mAh) is very close to the 120 mAh expected for a 1.5-electron transfer for AQDS.
The capacity is seen to increase slightly with cycle number until approximately cycle 135, after which it decreases rapidly to about 75 mAh at cycle 165. At this cycle, the posolyte was exchanged with a fresh solution of the same volume and composition as the original one, whereby the initial capacity (116.2 mAh) is almost fully restored after the exchange (115.2 mAh). Similarly, the faradaic efficiency is close to 100 % in the initial cycles but decreases with cycle number; after the posolyte replacement, it is restored to close to 100 %.
The understanding of the capacity-fade behaviour is dramatically improved by measuring the cell potential together with the redox potentials of the electrolytes using the OCV cell with internal reference. Fig. 7 shows the cell potential and the redox potentials of the posolyte and negolyte for three selected cycles (#15, #160 and #170). Cycle 15 represents the initial behaviour, cycle 160 the behaviour just before the posolyte exchange, and cycle 170 the behaviour after the exchange. For simplicity, only the charging curves are shown. The following observations can be made:
-
- In the initial cycles (#15), the cell voltage increases monotonically until the voltage limit of 1150 mV is reached, and charging continues until full charge is reached (116.2 mAh). In cycle 160, the voltage is generally higher and full charge is reached already at 80.8 mAh. After the posolyte exchange, the charging curve is almost restored compared to the initial one, with only a slightly smaller capacity.
- (2) The origin of this behaviour can be elucidated from the posolyte and negolyte redox-potential measurements for the same cycles, shown in the lower panel of Fig. 7. For the initial cycles (#15), the posolyte potential (ε+) only increases slightly, from about −50 mV to about 0 mV at full charge, whereas the negolyte potential (ε–) decreases much more, from about −650 mV to about −1000 mV at full charge. This is as expected, since the posolyte (402 mAh) is in excess compared to the AQDS negolyte (120 mAh), whereby the full range of the Nernst potential is observed for the negolyte.
- (3) At cycle 160, the posolyte potential is higher than initially and increases to about 150 mV at full charge (80.8 mAh). Meanwhile, the negolyte potential almost follows the same curve as initially, except that it terminates at the reduced full charge (80.8 mAh).
- (4) In cycle 170, after the posolyte exchange, the posolyte and negolyte potential curves are almost fully restored to those of the initial cycle 15.
- (5) In particular, the increase of the posolyte redox potential indicates that an overall oxidation of the battery takes place. Hereby, the posolyte and negolyte get out of balance, and the posolyte becomes the capacity-limiting factor.
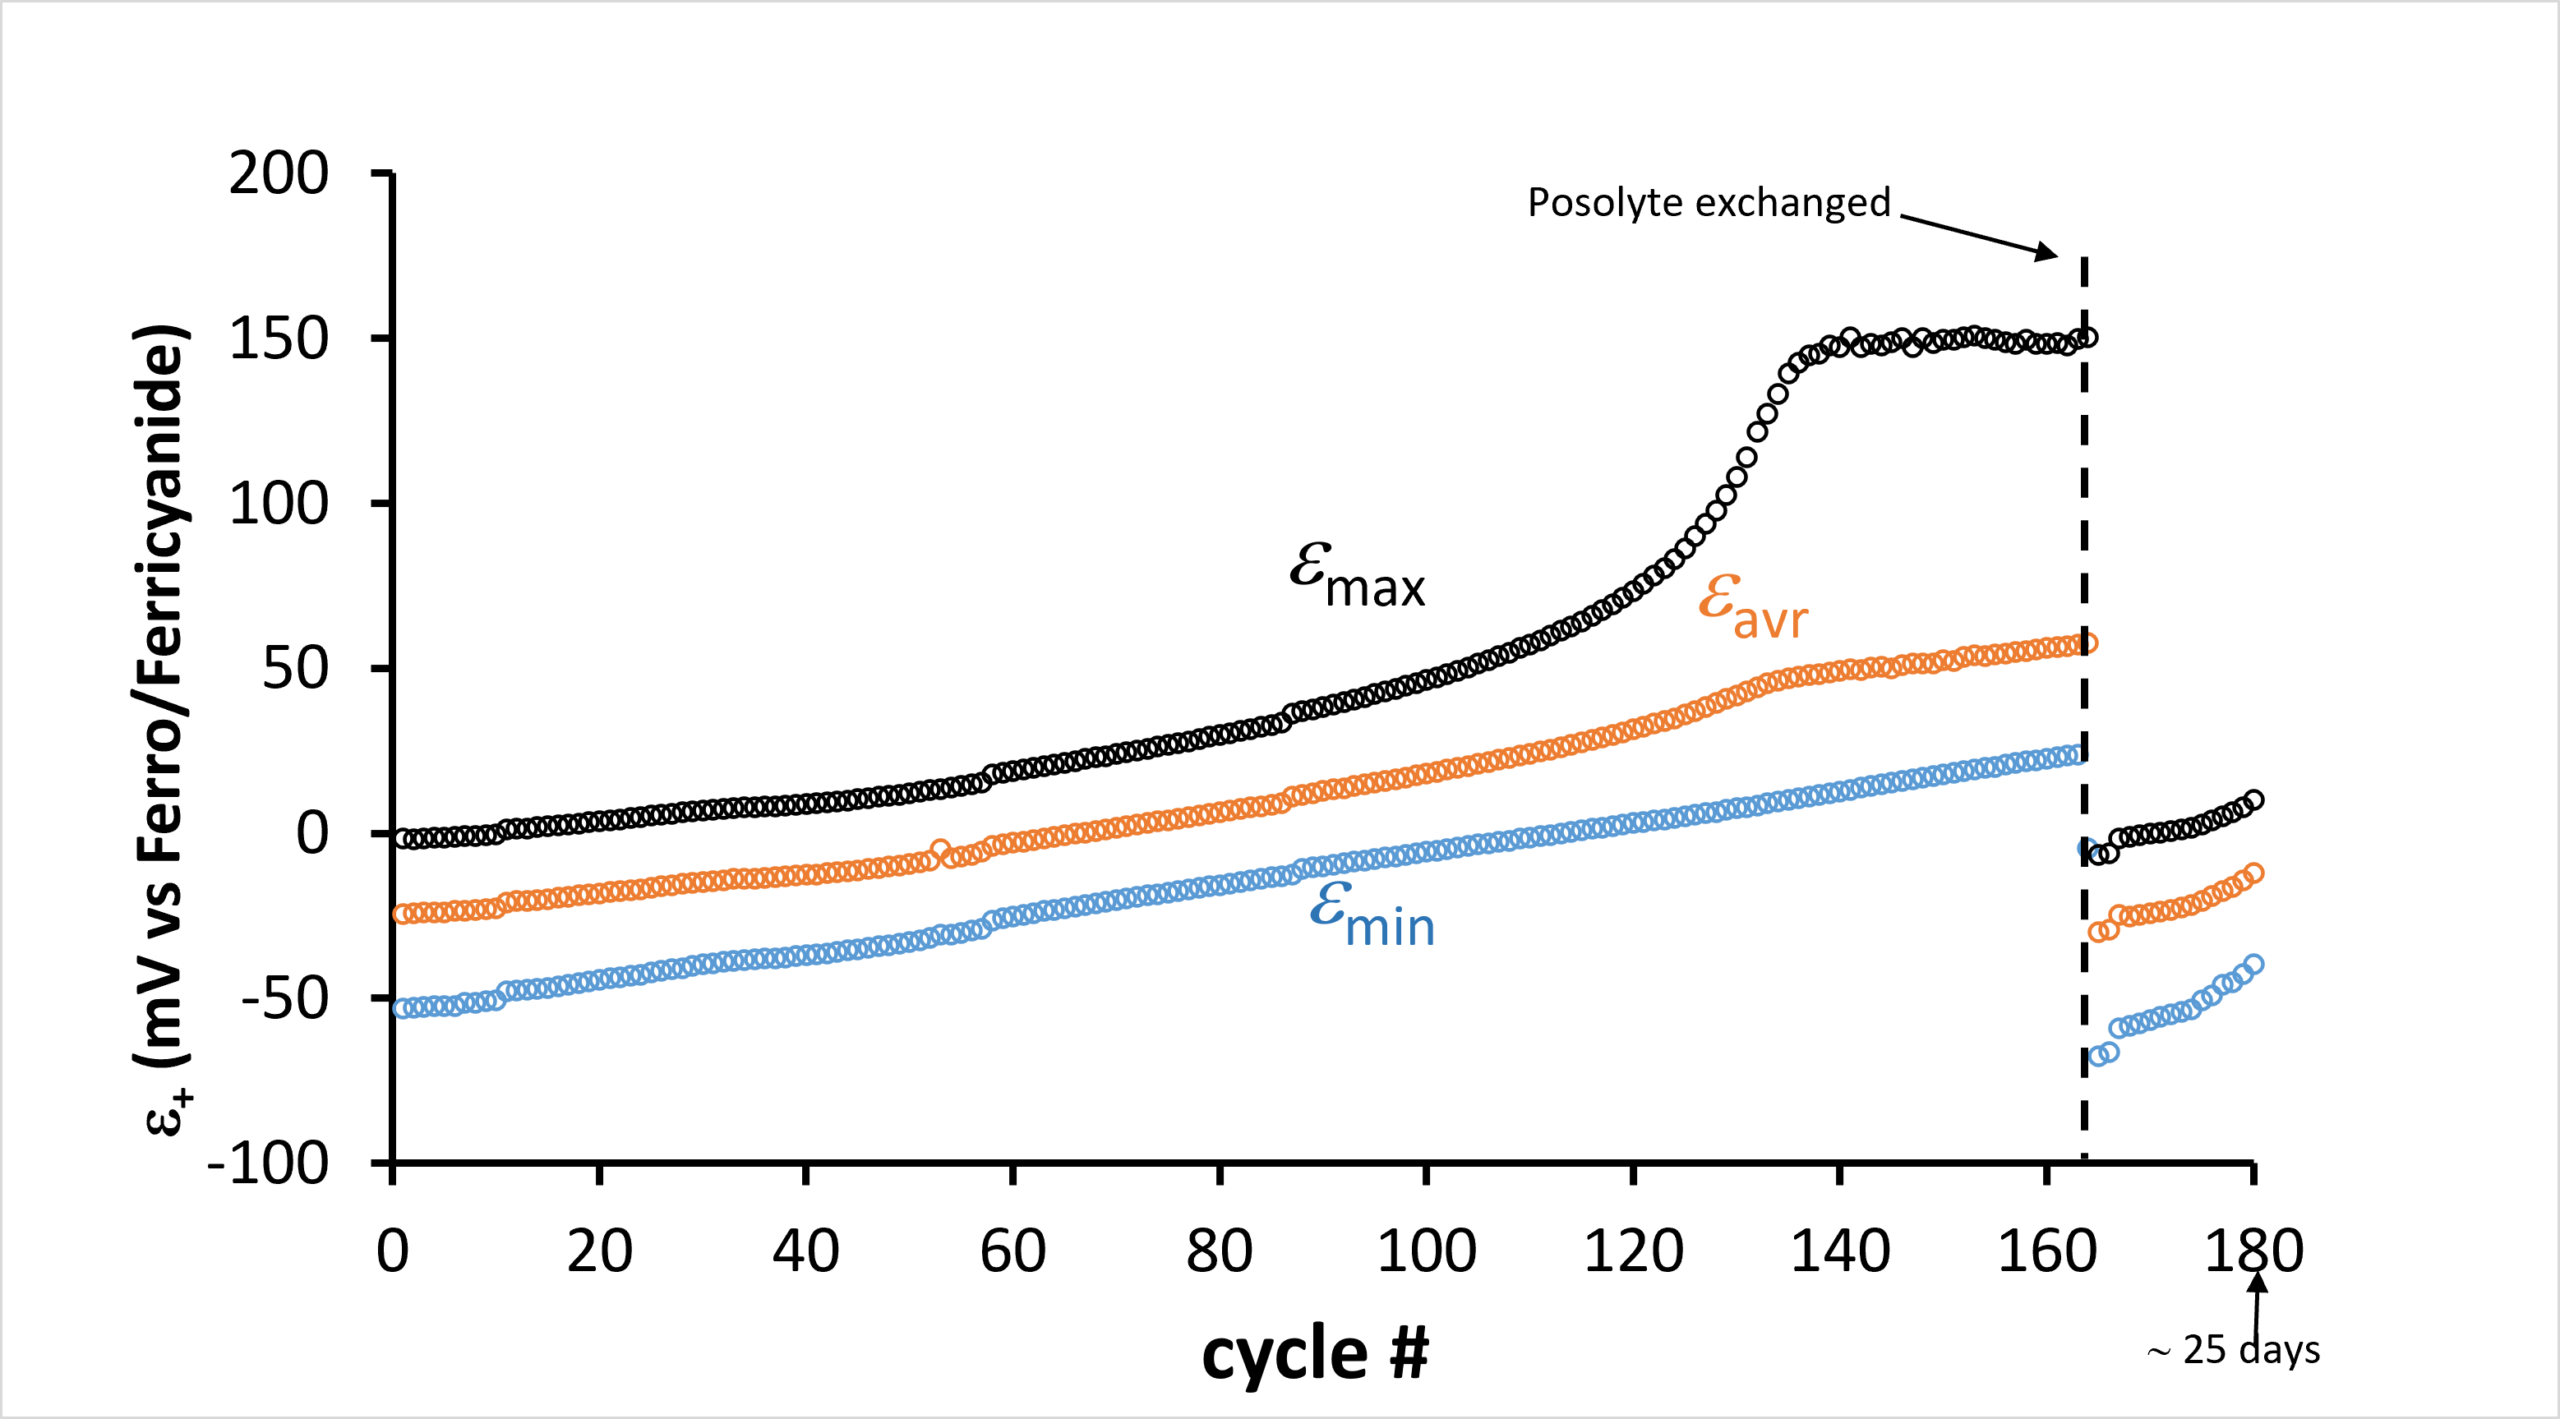
To investigate this further, the evolution of the posolyte and negolyte potentials as a function of cycle number is shown in Fig. 8. The evolution can be represented in several ways; ideally, it should be represented through the posolyte/negolyte SOC, but this would require accurate calibration tables between the SOC and ε+ and ε– , which is out of the scope of this white paper. Instead, the proxies εmax (the maximum redox potential measured at either full charge or discharge), εmin (the minimum redox potential measured at either full charge or discharge) and the time-averaged εavr have been calculated. The top panel of Fig. 8 shows these parameters for the posolyte. Both εmin and εavr increase monotonically with cycle number. εmax follows the same trend, but around cycle 130 it increases rapidly and reaches a value of about 150 mV. After the posolyte exchange, the potentials are restored to values slightly below the initial ones.
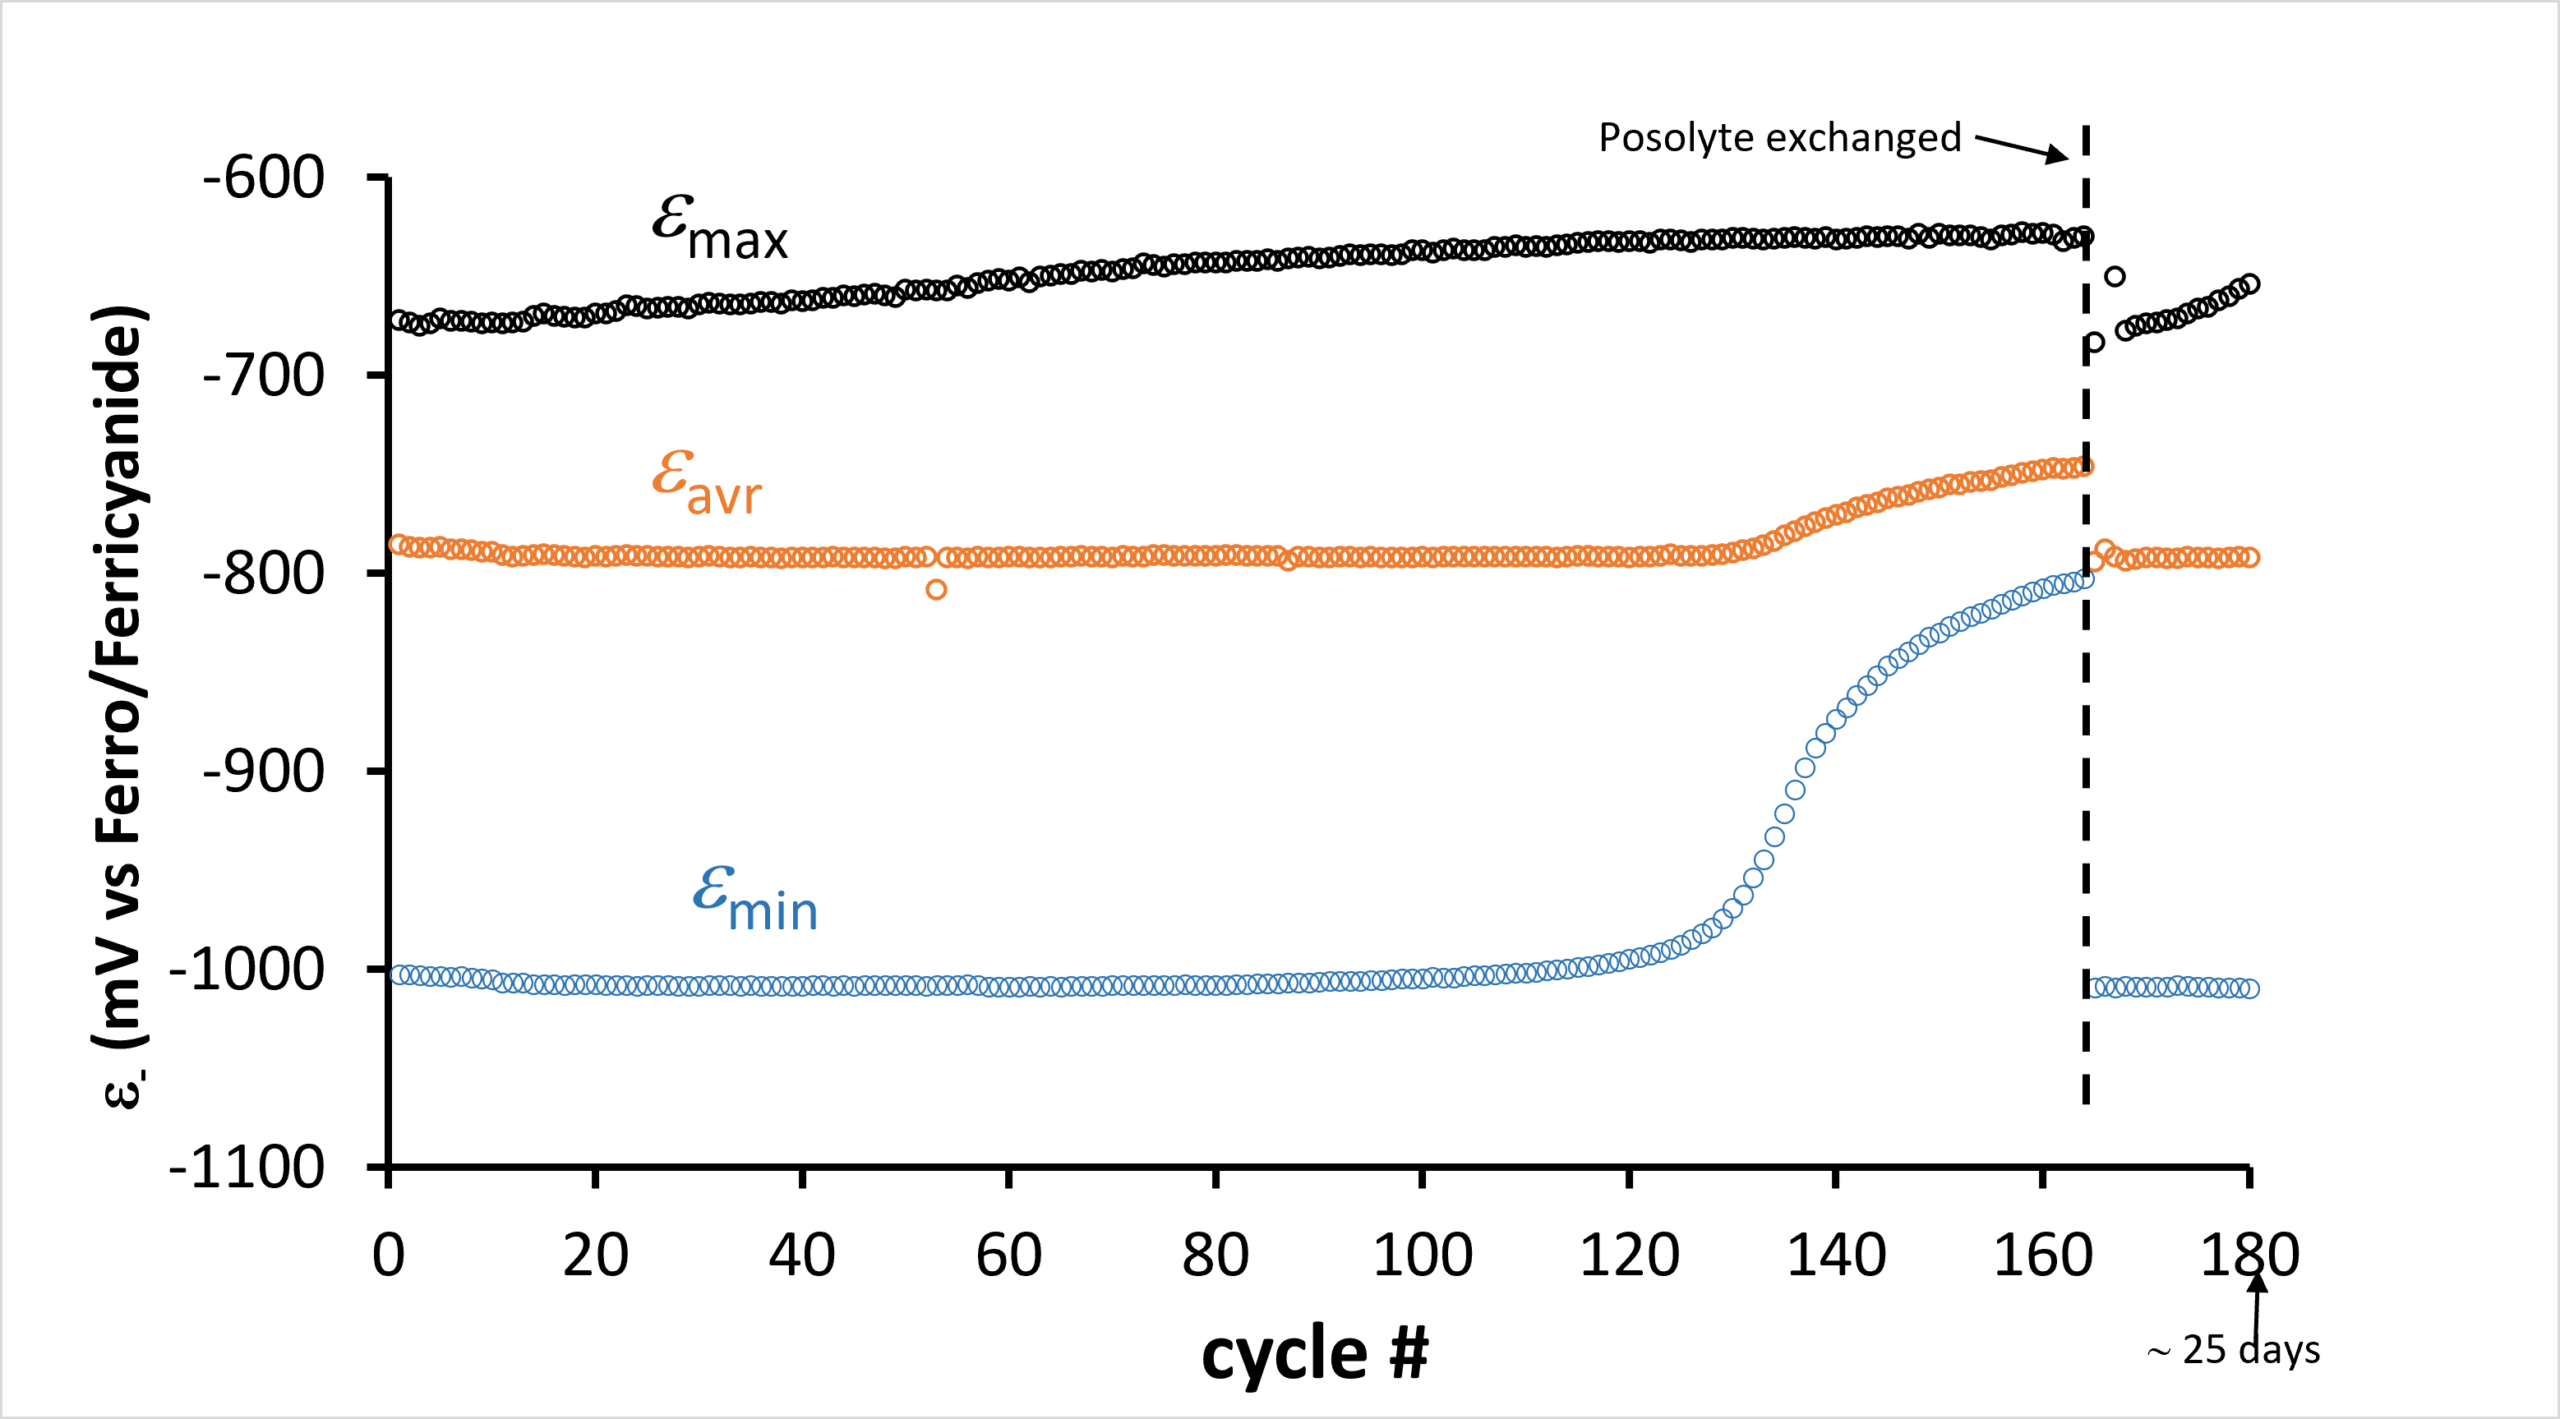
The lower panel of Fig.8 shows the same parameters for the negolyte. Here, a similar trend is observed: εmax increases slowly, while εavr is almost constant up to cycle 130, after which it increases. εmin shows the largest change; initially, it is almost constant at −1000 mV, while just before the posolyte exchange it reaches almost −800 mV. After the posolyte exchange, the redox potentials are almost fully restored to their initial values.
From Figs. 6 and 7, it could only be speculated that an overall oxidation/imbalance of the battery explains the large capacity fade after approximately cycle 130; Fig. 8, however, clearly demonstrates that this is the case. εmax for the posolyte reaches a maximum value of about 150 mV at full charge, and since it is measured against the ferro-/ferricyanide reference, this means that the posolyte SOC is above 99 % at this point, whereby the posolyte becomes the capacity-limiting side. Concurrently, εmin for the negolyte, i.e. the redox potential at full charge, increases rapidly after cycle 130. This shows that the AQDS can no longer be fully reduced, which corroborates the εmax data for the posolyte and demonstrates that the posolyte and negolyte have become imbalanced.
Summary
The tests presented in this white paper demonstrate the power of the combined setup of the 1 cm2 M-cell and the OCV cell with internal reference, which enables a full mapping of all relevant energy levels in a flow battery. As a demonstration, a long-term durability test with AQDS and ferrocyanide as the redox-active molecules was performed, showing the stability and functionality of the M-cell. The combined measurement of capacity, faradaic efficiency and electrolyte redox potentials made it possible to identify an oxidation-driven imbalance between the posolyte and negolyte as the origin of the observed capacity fade, information that is not accessible from standard cell-voltage measurements alone.
Considerations and recommendations
Choosing the right experimental setup for low volume flow battery cycling, mapping out energy levels and potentials can be done in many ways and how to mitigate effects of O2 in the air. The table below summarises some considerations for the choice of experimental setup.
|
When to use the M-cell for flow battery tests? |
|
|
Influence of O2 in air |
|
|
Mitigation of the effects of O2 from the air |
|
References
[1] Measurement of Overpotentials and Liquid Potentials in Flow Batteries, www.redox-flow.com
[2] Gonzalez, G., & Peljo, P. (2025). Experimental Set‐Up for Measurement of Half‐Cell‐and Over‐Potentials of Flow Batteries During Operation. Batteries & Supercaps, 8(2), e202400394.
[3] Langner, J., Melke, J., Ehrenberg, H., & Roth, C. (2014). Determination of overpotentials in all vanadium redox flow batteries. ECS Transactions, 58(37), 1.
[4] Fenini, F. Et al Impact of pH management on utilization and performance of anthraquinone/ferrocyanide flow batteries, Journal of Power Sources 540 (2022): 231641.
Interested? We’d like to hear from you!
Don’t hesitate to contact us with any kind of inquiries at
sales@redox-flow.com or call Mikkel Kongsfelt at +45-3126-2040