Introduction
Flow battery R&D is much driven by optimisation of electrodes and flow cell geometry. In a standard lab type flow battery setup, it is only the electrical current and cell potential that is measured. Although these two parameters alone determine the overall performance, it is from an R&D perspective desired to understand which parts and components that contributes to the overall energy losses. This white paper focuses on the experimental possibilities for mapping these losses out.
Note that this white paper only applies for reversible electrochemical systems, like flow batteries. For irreversible electrochemical systems like water electrolysis other methods are needed.
Definition of Energy Levels
Fig. 1 below is a general representation of the energy levels in a flow battery (or any other reversible electrochemical flow system). In the figure the blue scale represents absolute energy levels with respect to e.g. SHE. On the absolute scale the abbreviations are:
-
- εCC- and εCC+ : The potential on the negative and positive side current collectors
-
- ε– and ε+ : The (redox) potential of the liquid on the negative and positive side – note that it is variable and depends on the state-of-charge and is described by the Nernst equation
-
- εref : The potential of (a) reference electrode(s) in the setup
While the upper (blue) potentials are absolute energy levels, the lower (orange) parts show the measurable voltages. Here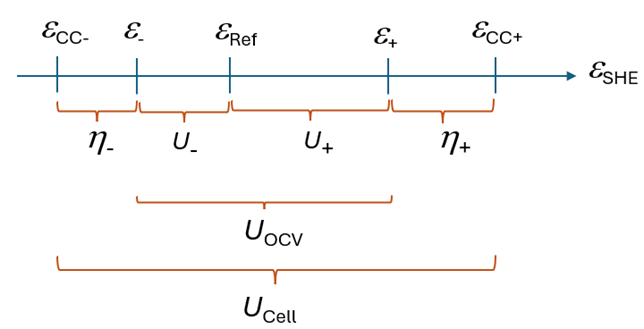
While the upper (blue) potentials are absolute energy levels, the lower (orange) parts show the measurable voltages. Here
-
- η– and η+ : The overpotentials for the charging (discharging) the negative and positive side liquids
-
- U– and U+: Measured potentials with respect to a reference electrode to determine the liquid (redox) potentials of the negative (ε– ) and positive side (ε+)
-
- UOCV: Potential measured in an OCV cell
-
 : The potential measured on the electrochemical cell by battery tester or potentiostat
The overpotentials and the electrolyte redox potentials are the most important parameters for mapping out internal resistive losses. There are multiple ways for a total mapping out of ![]() ,
, ![]() ,
, ![]() and
and ![]() and only two are outlined below.
and only two are outlined below.
Setup with Reference Electrodes and OCV Cell
Fig. 2 shows a generic representation of how the energy levels are completely mapped out by use of reference electrodes. The red lines depict the hydraulic circuit, while blue lines are potential measurements and the black part are units in the hydraulic circuit. This includes bottles, pumps, reference electrodes, flow through electrode holders, OCV cell and flow battery cell.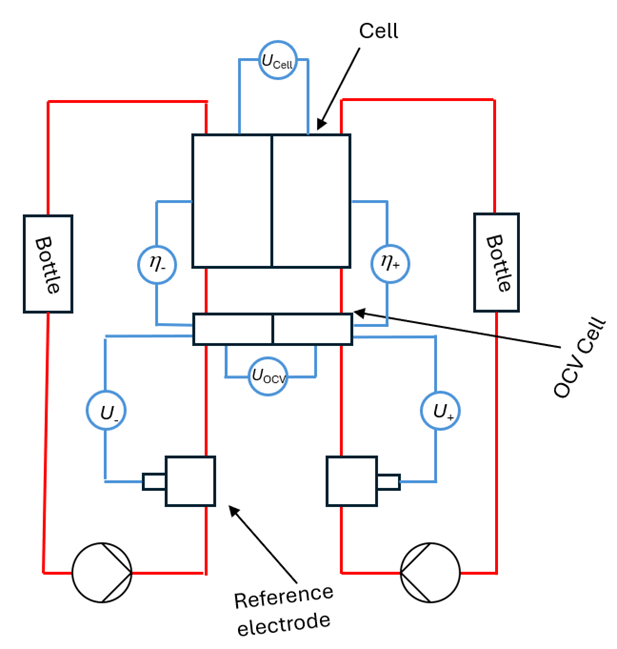
The voltage difference between the negative side of the OCV cell and the current collectors on the flow cell measures the negative side overpotential (![]() ) and vice versa for the positive side overpotential (
) and vice versa for the positive side overpotential (![]() ). I.e. the difference between the applied potential to the current collector and the potential of the solution. The voltages
). I.e. the difference between the applied potential to the current collector and the potential of the solution. The voltages ![]() and
and ![]() measured between the reference electrodes and the OCV cell can be related to the redox potentials of the solutions (
measured between the reference electrodes and the OCV cell can be related to the redox potentials of the solutions (![]() and
and ![]() ). Depending on the sign definitions and the electrical connections,
). Depending on the sign definitions and the electrical connections, ![]() and
and ![]() , where
, where ![]() is the standard potential of the reference electrode.
is the standard potential of the reference electrode.
An experimental setup based on a 12A/5V tester, a S-cell with 25 cm2 active area, with AV Carb (G475) thermally treated carbon felt electrodes and Fumatech FS930 electrode was assembled in a circuit similar to the one in fig. 2. Reference electrodes (double junction calomel) were inserted into redox-flow.com flow through electrode holders. The OCV cell was mounted with a FS930 membrane.
The reference electrodes were calibrated against a pristine V3/4+ solution and values around 0.19 V were consistently measured over time. In all tests standard 1.6 M vanadium solutions were used for tests and ambient temperatures were in the range 22°C – 24°C.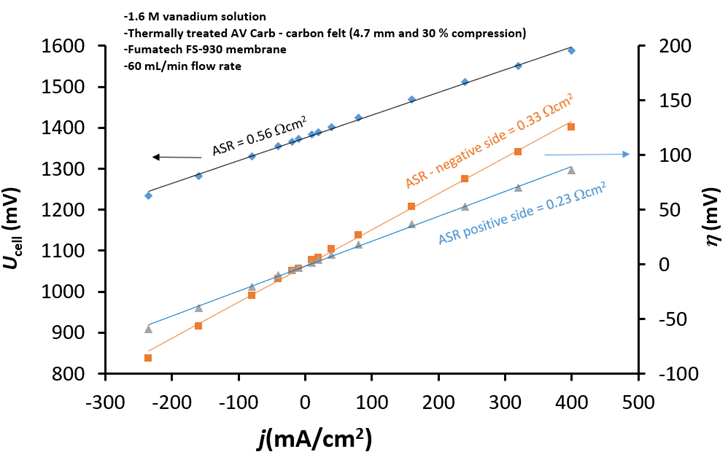
Fig. 3, shows the polarisation curve measured at 50 % State-of-charge (SOC). Here a very low internal area specific resistance (ASR) of 0.56 Ωcm2 was found. From the overpotential measurements the contributions were found to be higher for the negative side (0.33 Ωcm2) compared to the that of positive side (0.23 Ωcm2), and is in agreement with scientific literature. It can also be seen that the two half-cell ASRs add up to the total value. In the figure both overpotentials are defined as positive on charging and negative on discharging, other sign conventions can be used and defined from Fig. 1.
To further demonstrate the capabilities of the setup, Fig. 4 shows the first initial (pre) charging to full 100% SOC for a vanadium flow battery with 8 A (320 mA/cm2). The top graph shows the cell potential, OCV and redox potentials of the negative and positive side with respect to V3/4+ (![]() , where
, where ![]() refers to sign definitions and electric wiring). The capacity of the battery is about 2787 mAh and it is seen that both
refers to sign definitions and electric wiring). The capacity of the battery is about 2787 mAh and it is seen that both ![]() and
and ![]() remain low but increasing with capacity until approximately 1400 mAh where both increases suddenly due to the initial pre-charging is finished and the electrolyte gets into the in 0 % SOC. After this
remain low but increasing with capacity until approximately 1400 mAh where both increases suddenly due to the initial pre-charging is finished and the electrolyte gets into the in 0 % SOC. After this ![]() and
and ![]() increases until maximum SOC is reached.
increases until maximum SOC is reached.
Also, UOCV is measured from the OCV cell and shown in the figure, alternatively it could also be constructed from the measured redox potential (UOCV = ![]() –
– ![]() ). A comparison show that they are within 5-10 mV of each other, this discrepancy is primarily attributed shunt currents (see below). In the range where the precharging is about to finish the difference is larger. This discrepancy is attributed to the short charging time (25 min), relatively low flow rate and different time constants for the units. I.e. due to the double junction (high resistance) of the calomel electrodes it is expected that they are reacting a little slower than the OCV (low resistance). The consequence is that the system is not in equilibrium. A slower charging and higher flow rate would give more consistent results.
). A comparison show that they are within 5-10 mV of each other, this discrepancy is primarily attributed shunt currents (see below). In the range where the precharging is about to finish the difference is larger. This discrepancy is attributed to the short charging time (25 min), relatively low flow rate and different time constants for the units. I.e. due to the double junction (high resistance) of the calomel electrodes it is expected that they are reacting a little slower than the OCV (low resistance). The consequence is that the system is not in equilibrium. A slower charging and higher flow rate would give more consistent results.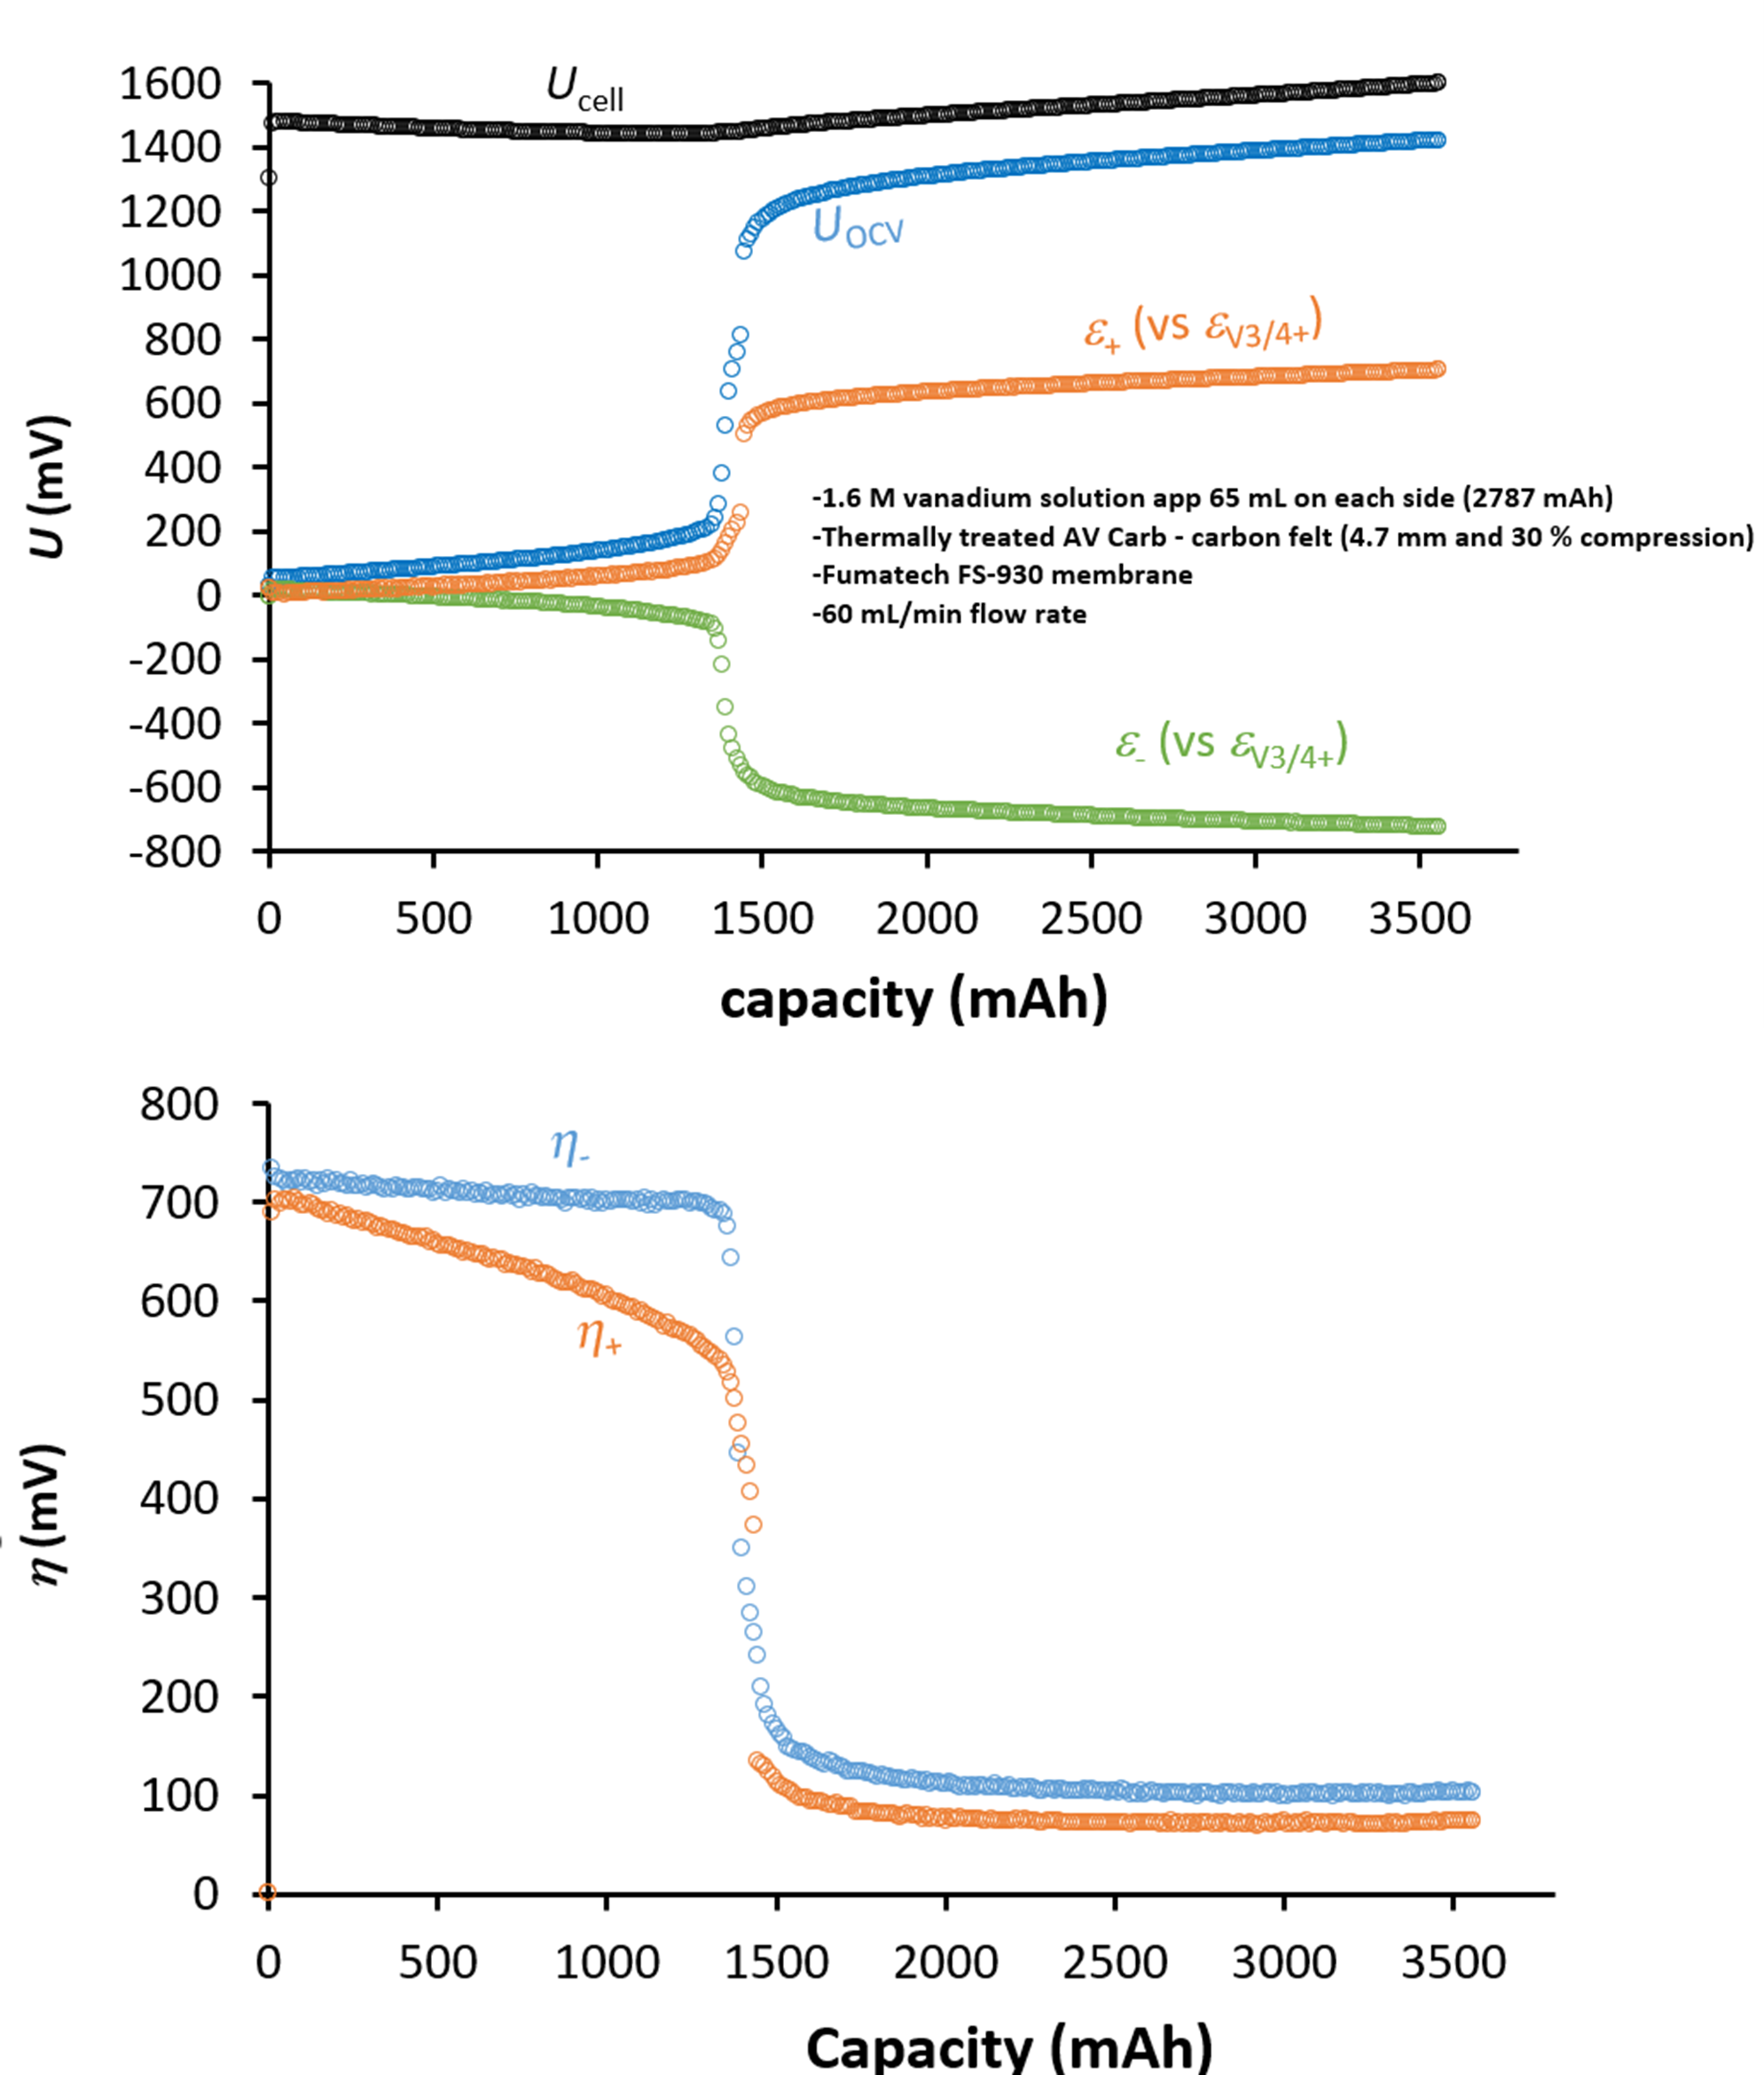
Lower graphs in fig. 4, shows the negative and positive side overpotentials. Here it is seen that there is a significant overpotential associated with the pre-charging of the electrolyte. However, once the electrolyte reaches 0 % SOC and onwards, the overpotentials drops to about 80-120 mV.
Setup with OCV Cell with Internal Reference
Redox-flow.com has developed a unique OCV cell that enables addition of a central chamber to the OCV cell. This central chamber can be used as an ‘internal’ reference electrode in the OCV cell and replace the reference electrodes used in the other setup.
Schematic figure below shows the setup. Again, red and blue lines refer to the electric and hydraulic circuit respectively, while the black parts are units in the circuit.
As in the previous setup, the overpotentials (η– and η+ ) are measured directly between the outer chambers of the OCV cell and electrochemical flow cell. While the redox potentials (ε– and ε+) are measured with respect to the redox solution in the central chamber through the voltages U– and U+.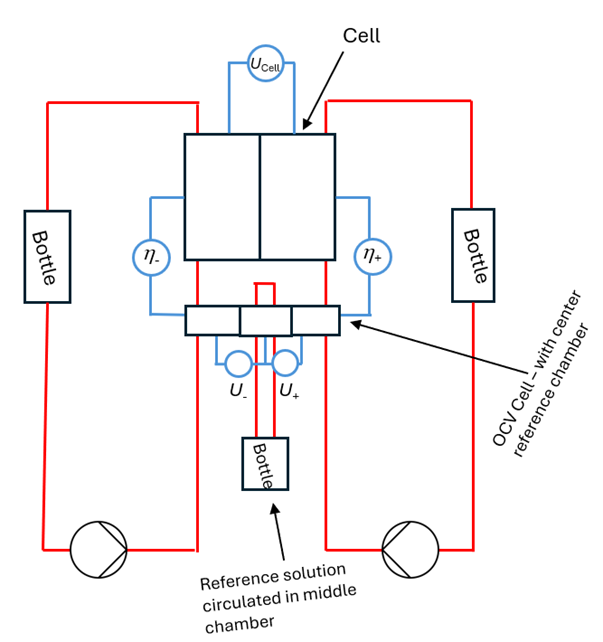
The central chamber reference solution is circulated from an external third bottle. If the reference solution is not circulated the reference solution may ‘drift’ as the membranes are not fully permselective, whereby the reference potential changes with time. There can be specific chemistries, membranes or short experimental times where circulation is not necessary, however, Redox-Flow.com recommends as default to use circulation if this option is used.
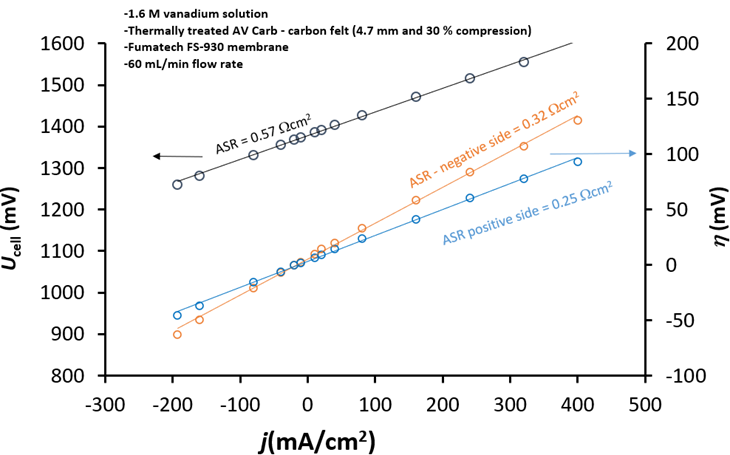
Fig. 6 shows the polarisation curve at 50 % SOC and an ASR of 0.57 Ωcm2 is found and within experimental uncertainty of the 0.56 Ωcm2 found in the normal OCV setup. Also the ASRs for the negative (0.32 Ωcm2) and positive (0.25 Ωcm2) are very close to the ones found in the previous test. This not only underlines the robustness of the method, but also that both setups are suitable for measurement of overpotentials.
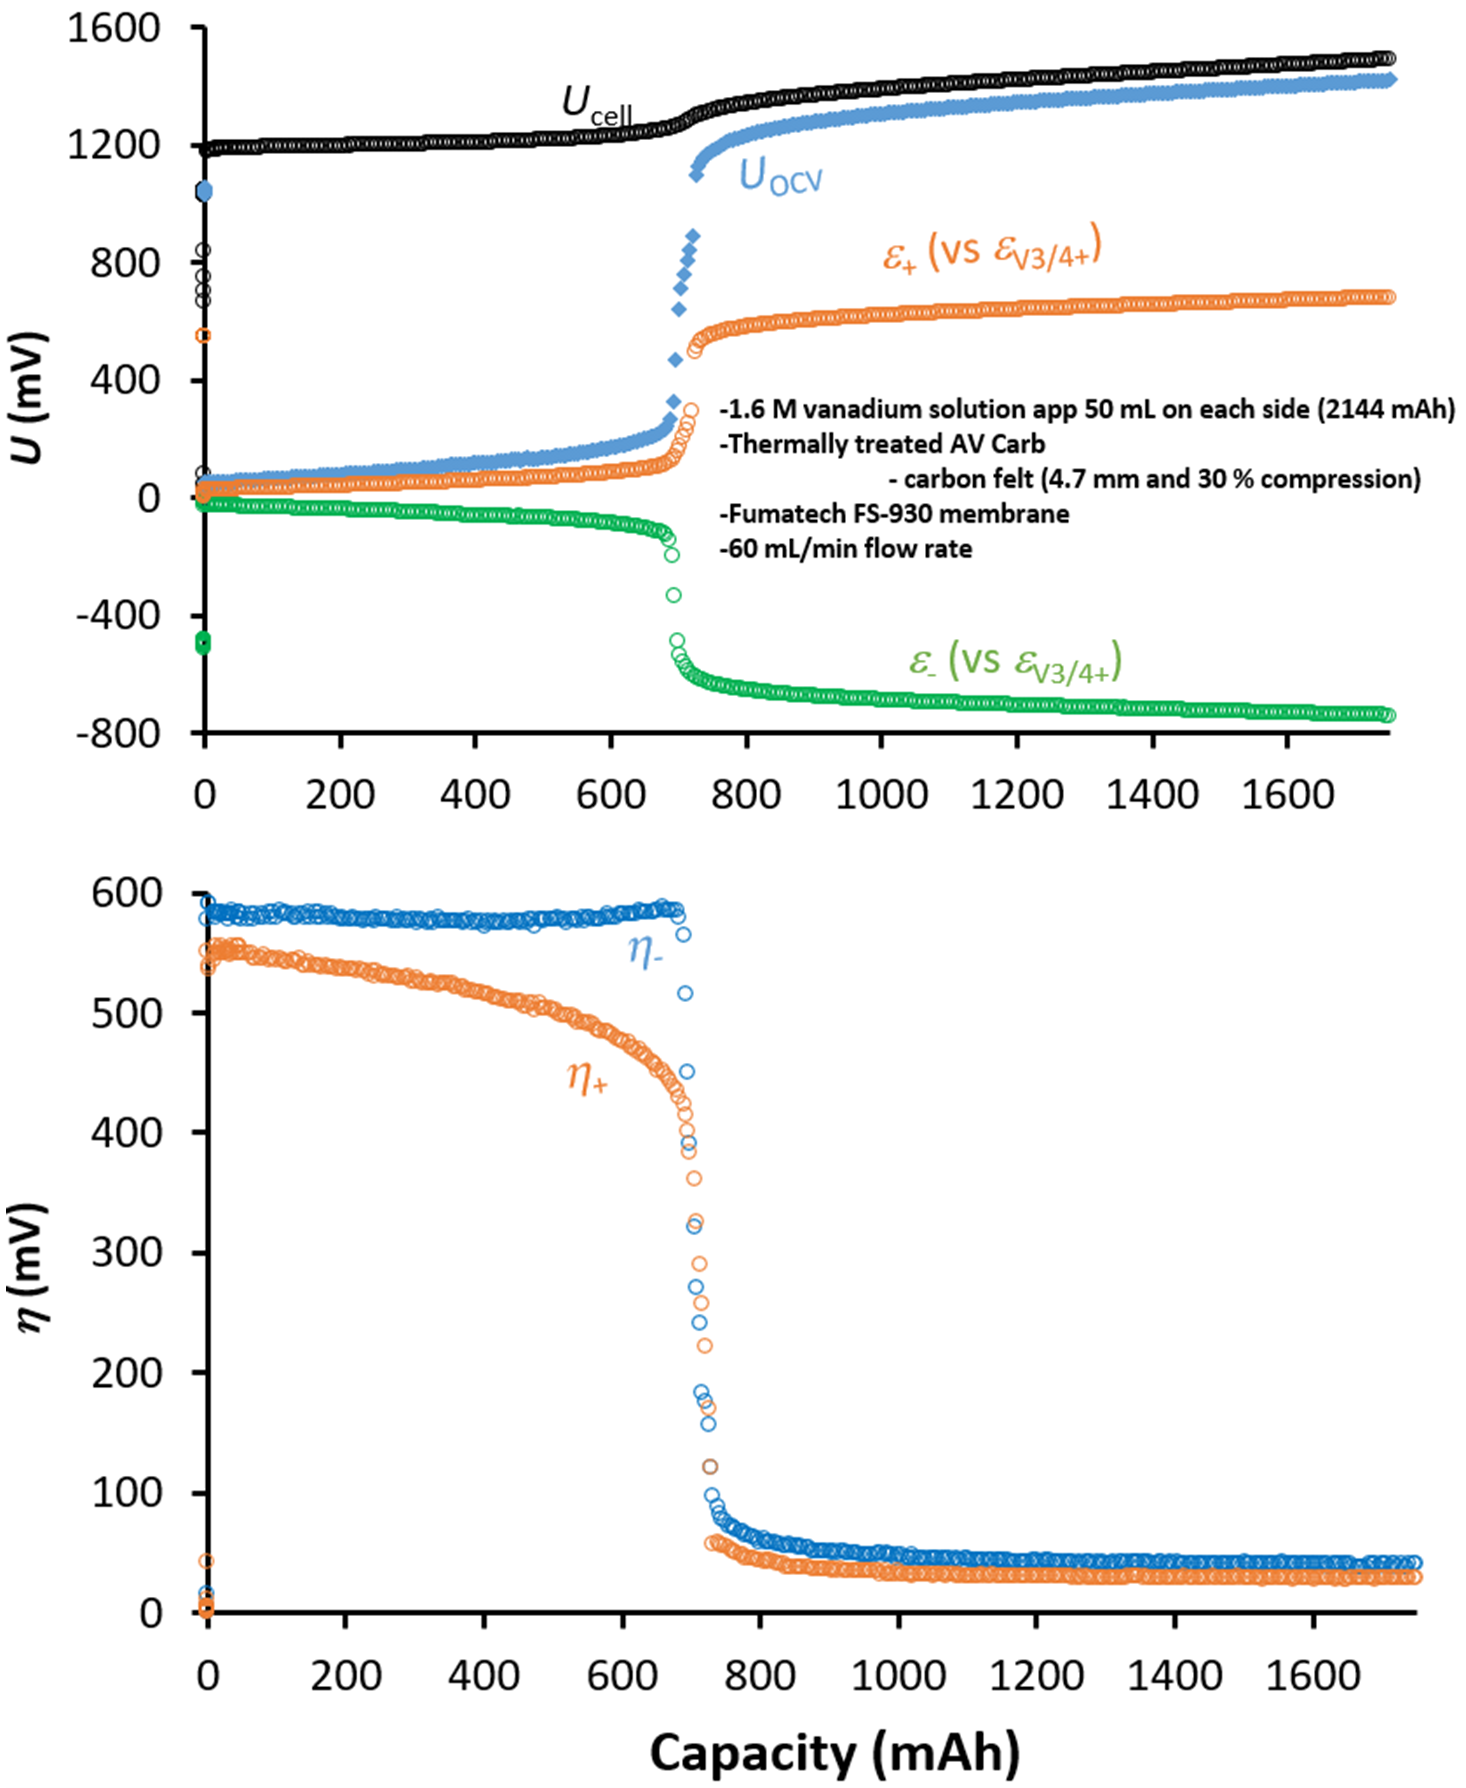
To demonstrate the capabilities of the setup, Fig. 7 (similar to Fig.4) shows the first initial (pre) charging to full 100% SOC for a vanadium flow battery with 3 A (120 mA/cm2). The central reference chamber of the OCV cell is circulated with pristine V3/4+ vanadium solution at a rate of 60 ml/min (same solution as used in the flow battery cell). The top graph shows the cell potential, OCV and redox potentials of the negative and positive side. Since the reference solution is V3/4+ no conversion/calibration of the voltage measurement is needed. Overall, the trend is the same as for the setup with reference electrodes and demonstrates the functionality of the OCV cell with reference chamber.
Cycling Data and Hydraulic Shunt
To further demonstrate some of the potential R&D applications, a battery cycling test was conducted on the setup with the OCV cell with internal reference. Here the cycling parameters were 3A constant current charging/discharging to 1.6 V and 0.8 V, followed by constant voltage charging/discharging down to 0.3 A.
Fig. 8 shows the charge/discharge capacity vs the cycle number. As can be seen the capacity retention drops quite fast as the battery is cycled. This mechanism behind the capacity is quite complex but mainly determined by cross-over of vanadium from one to the other side, whereby the other side becomes the capacity limiting factor. To balance out this cross-over and volume changes in the two bottles, the bottles are in many cases connected with a tube/hydraulic shunt. This is switched on after cycle 21. Here it is seen that the capacity is somewhat restored in the subsequent cycles (some of the electrolyte also becomes inactive in the syringe used in the shunt, explaining partly the missing capacity).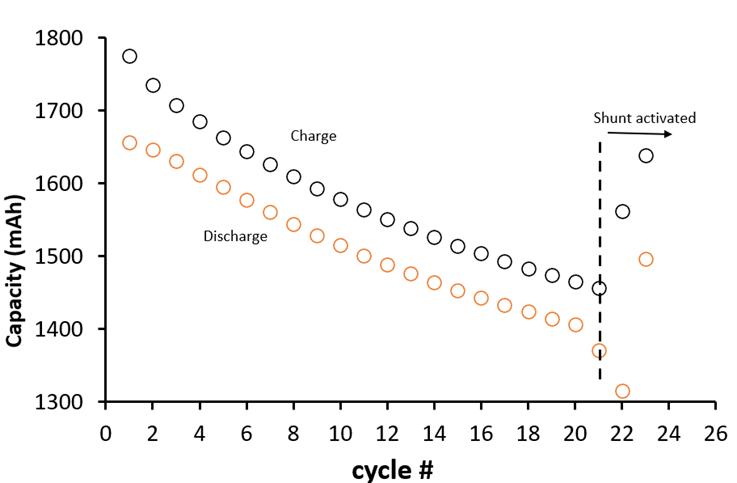
The understanding of the capacity fade can be improved by measuring the liquid redox potentials of the solutions with OCV cell with internal reference as shown in fig. 9. From the liquid potentials on the negative side it is seen that they have a sharper decrease on discharge as it approaches 0 % SOC (and sharper increase on charging) compared to that on the positive side. This is a clear indication that the negative side, is the capacity limiting side and that vanadium ions are transferred to the positive side during repeated cycling. Once the hydraulic shunt is opened, these cross-over effects are mitigated and capacity is (somewhat) restored.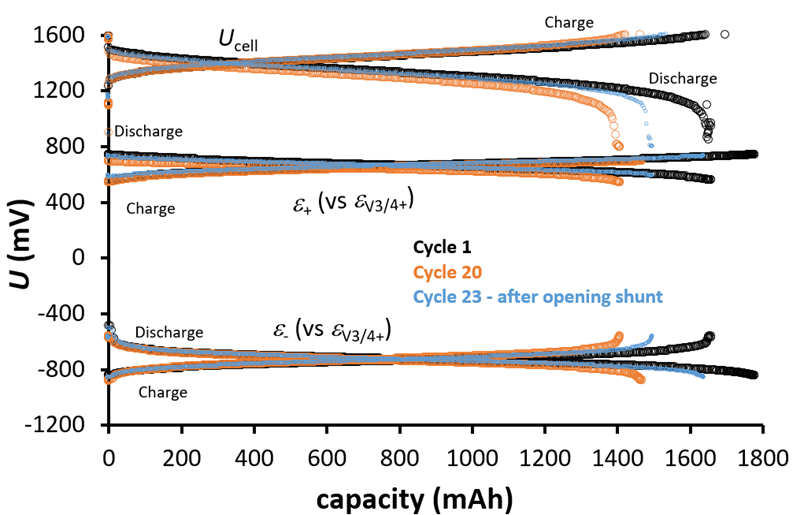
,  and
and  for cycle 1, 20 and 23 on charge and discharge.
Shunt Currents
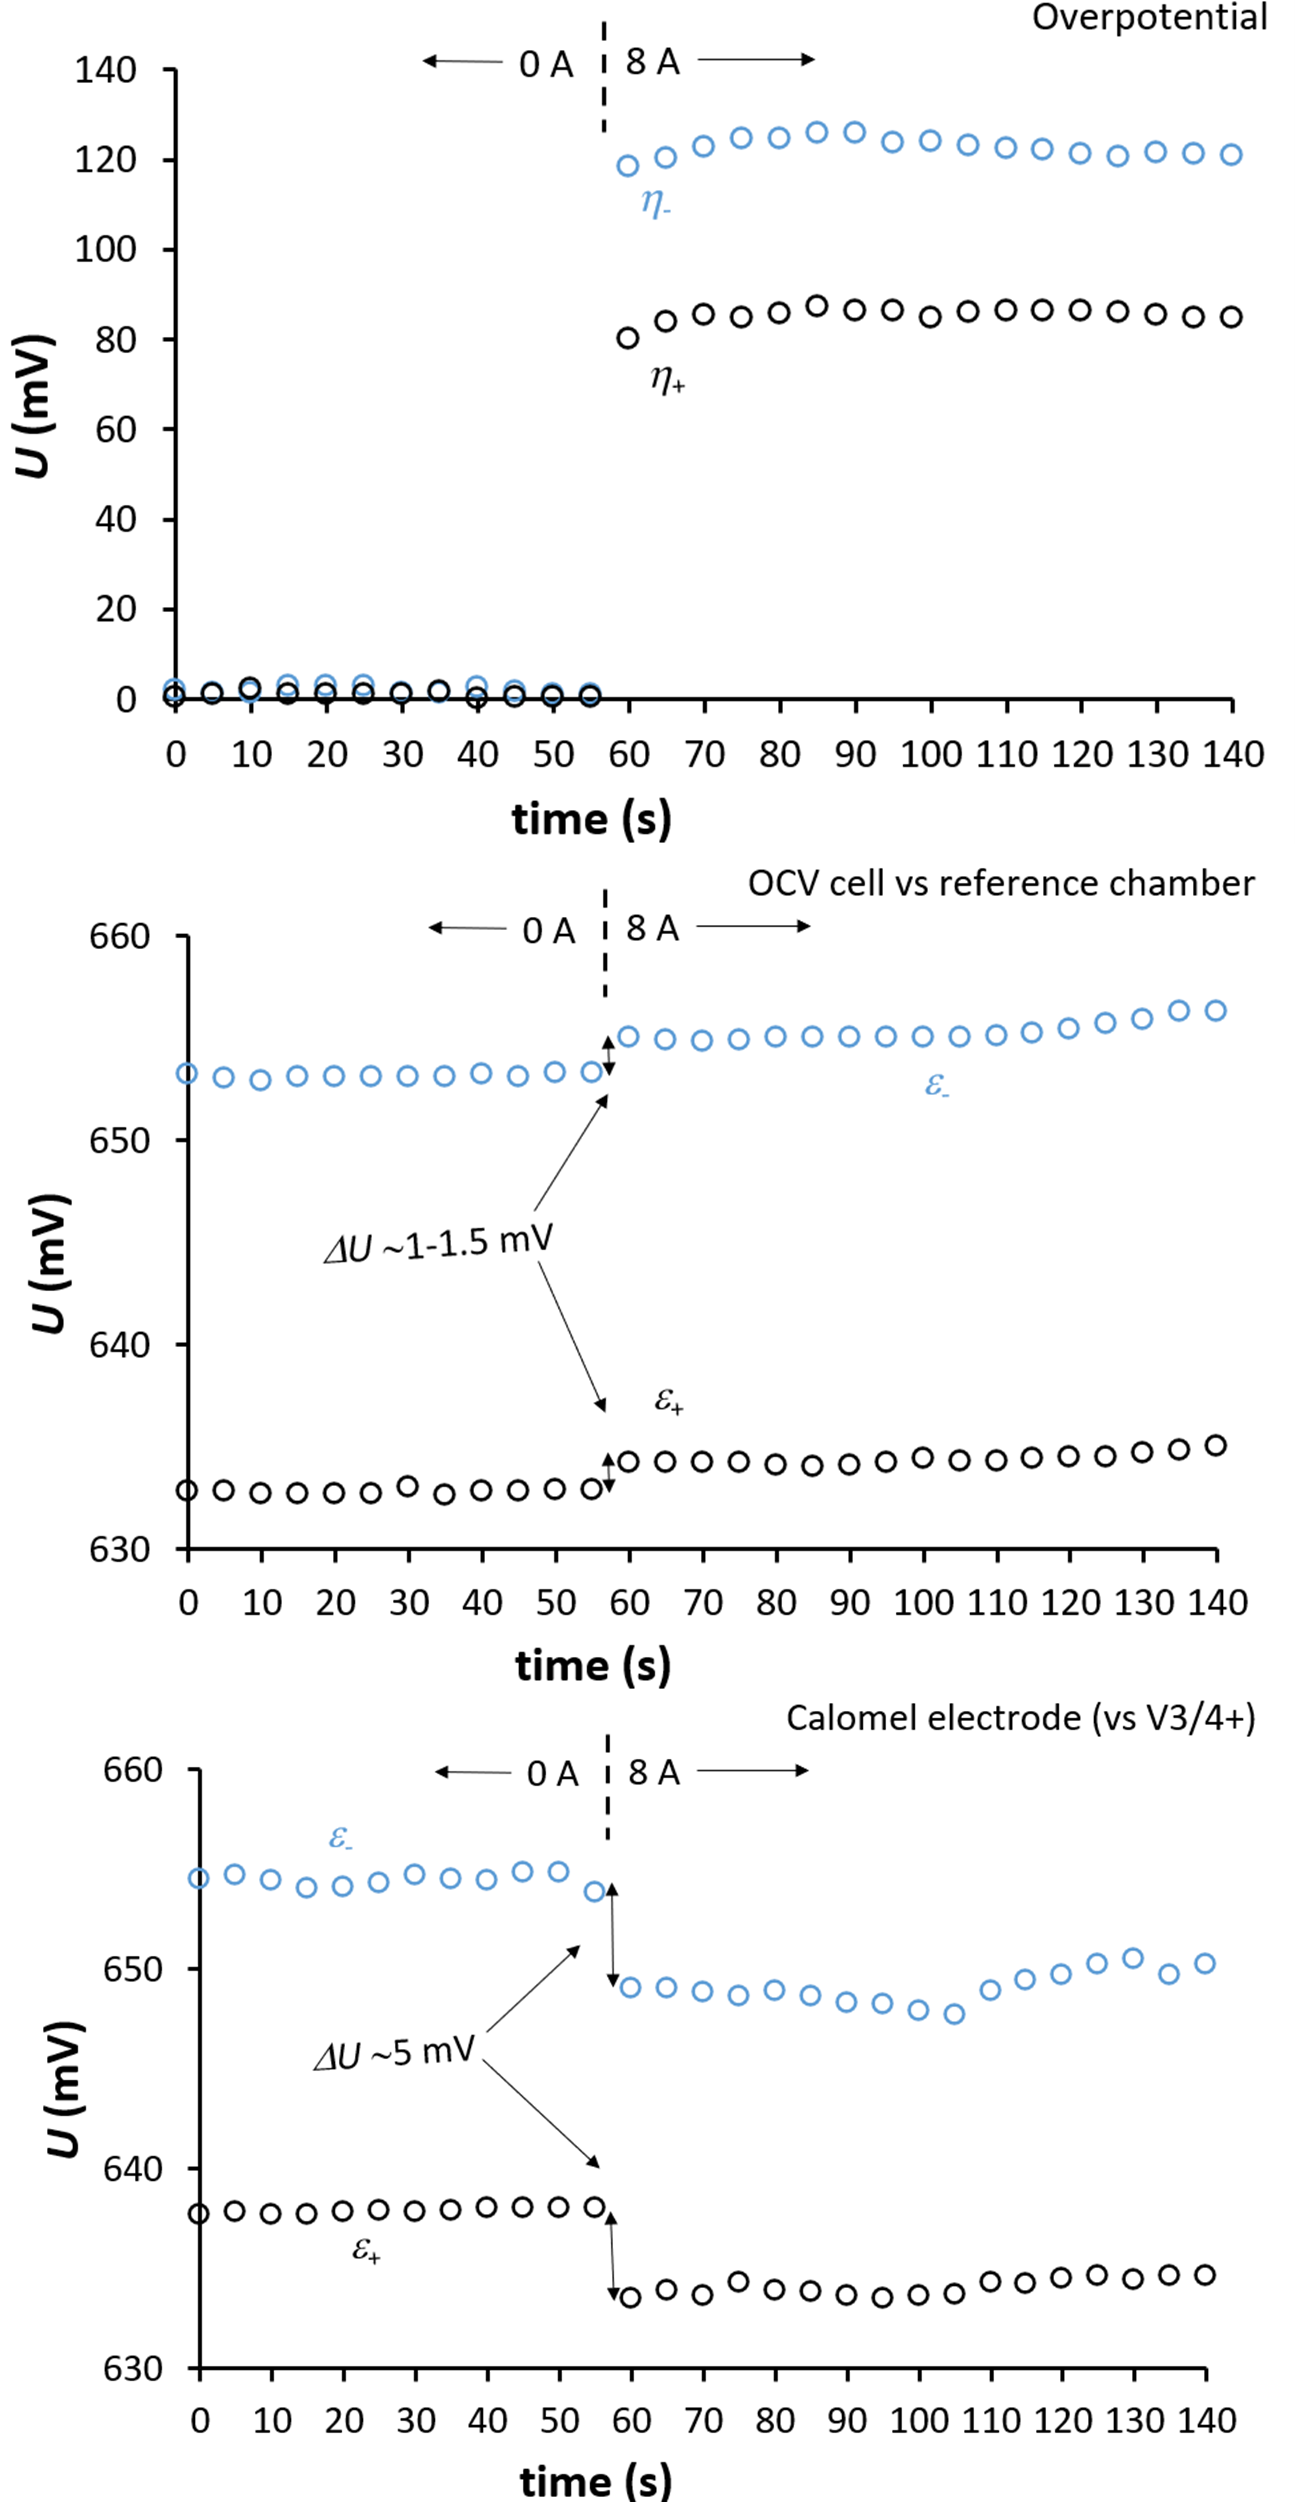
It has been reported that shunt currents through the OCV cell can affect the overpotential measurements. To investigate the magnitude of this effect, an experiment where both the ‘OCV cell with internal reference’ and reference electrodes were inserted into the same experimental setup. It was charged to a specific value and left resting until all potential measurements were stable. Then 8 A (pulse) charging was applied, and all potentials were monitored as function of time. Results are shown in fig. 10. The top graph shows the overpotential measurements and as expected a sharp increase is seen when the current is applied, and the voltage change is considered as being the overpotential.
It is expected that ε– and ε+ should remain constant (no change of SOC within seconds of the charging). If this is not the case, it can be seen from Ucell = ε–+ε++η–+η+ (fig. 1) that this would lead to an error in the overpotential (η–+η+) measurement. As can be seen from the middle graph in fig. 10, the potential change of ε–and ε+ is about 1-1.5 mV and the error on the overpotential 80-120 mV (top graph) is only of the order 1 % and not as high as reported elsewhere in literature. It is anticipated that the low impact is due to the low internal resistance of the redox-flow.com OCV cell. The tube length (1/16’’ ID) from cell to OCV cell is total about 20 cm and results in approximate 0.06 mA shunt current through the OCV cell. It is anticipated that the OCV cell with internal reference chamber has a very low internal resistance of about 10 Ω, which would result in a potential loss of about 0.5 mV and in relative agreement with the value of about 1 mV.
As a last point, the lower graph shows the response of the calomel electrodes. Here a larger potential change of about 5 mV is seen. This potential change does not as such affect the overpotential measurement but will lead to error in the liquid potentials. This error should not be compared directly to the overpotentials measurement, but to the relative change over a full SOC, which is of the order 200 mV. In this case it is still relatively small, but there can be specific experiments where this error is unacceptable and here it is recommended to use a blocking sheet (PTFE) inside the OCV cell that is supplied with the OCV cell. The blocking sheet isolates the two sides of the OCV cell and prevents shunt current, hereby it no longer works as an OCV cell, but can only be used for overpotential measurements.
Internal Resistance of Electrochemical Devices and Measurement of Voltage Signals
The voltage from the OCV cell and reference electrodes in the experiments above have been measured with the AUX unit that can be supplied together with the battery testers sold by Redox-Flow.com. When measuring on electrochemical devices/sensors it is important to understand the magnitude of the internal resistance of the device. I.e. the internal resistance of the OCV cell is in the range 5-50 Ω depending on configuration, membrane and chemistry. The double junction calomel electrode has an internal resistance of about 3-8 kΩ. Internal resistances below 10-30 kΩ are ‘considered’ as low and can be measured by standard voltmeters (that typically have internal resistances > 100 kΩ). Nonetheless, it is paramount that the voltage measurement device is bipolar. I.e. the voltage measurement device cannot share a common 0/zero for measuring multiple potentials.
Besides this, in some cases it can be considered to include galvanic isolation between the electrochemical device and voltage measurement unit. If there is a voltage bias between the experimental setup and the measurement unit, this can lead to galvanic/electrical currents between the electrochemical sensor and measurement unit, this will quickly deteriorate the electrochemical sensors and give false readings. Alternatively, this can also be mitigated by grounding all devices in the setup that is connected to grid power to the same ground, connecting all devices to the same ground connection can minimise/remove voltage biases. Also, for many other good reasons grid powered devices in the same experimental setup should always be connected to the same ground.
Considerations and Recommendations
Choosing the right experimental setup for mapping out energy levels and potentials can be done in many ways. However, in many applications it is not necessary to make a full mapping and is there redundancy is the measurements. Table below summarises some of the considerations for the experimental setup
| What kind of measurement is needed? | OCV only?Overpotentials?Electrolyte redox potential – for one side only or both sides? |
| Shunt currents through OCV cell | It is easy to measure through a direct current pulse measurement How accurate does the measurement need to be?Consider tube lengths and placement of unitsIf there is a hydraulic shunt between electrolyte bottles (only for vanadium flow battery systems), what impact can that have on shunt currents |
| Time delays in the electrochemical and hydraulic system | As the units (reference electrode, OCV, flow battery cell) comes in series there can be some delay in the response depending on dead volumes, flow rates and electrical current. I.e. higher flow rates and lower electrical currents will mitigate this. |
| Measure before / after electrochemical cell | Whether to measure before or after the flow battery cell, depends on the specific aim of the test. For standard tests like the ones in this note, we recommend measuring before. |
| Electrical measurements | Both the OCV cell and the double junction reference electrodes of redox-flow.com are ‘low impendance’ and the voltage can be measured directly on standard voltmeters and data loggers. However, the voltage must be measured in a bipolar manner (i.e. no common 0 between several independent voltage measurements). |
| Reference electrodes | In most redox-flow batteries the electrolyte concentrations are so high that a large osmotic pressure difference is built up between electrolyte in flow battery and reference electrode. This will result of pollution/deterioration of the reference electrodes. So always use double junction reference electrodes. |
Finally, the table below shows some of the advantages/disadvantages between using a setup with an OCV cell with internal reference or reference electrodes. Redox-flow.com does not promote one over the other, we have developed the OCV cell with internal reference because we are ‘electrochemical nerds’, so consider the internal reference as a research tool
| Advantages | Disadvantages | |||
| Reference electrodes with standard OCV cell | Well described in literatureShunt currents can be blocked in OCV cell | Calibration of reference electrodes Drifting of reference electrodes over prolonged testing time | ||
| OCV cell with internal reference | Only need one unit for a full mappingHydraulic circuit becomes very simple – few connections and fittingsThe internal reference option/middle chamber is included as an option with the redox-flow.com OCV cellPotentially no calibration of ‘reference solution’ – depending on chemistry | The reference electrolyte must be circulated in the central chamber (can relatively easy be done with peristaltic pumps, if an additional pump head can be added to the pump) There are limited number of reference electrolyte solutions avaible. For vanadium flow batteries V3/4+ solutions can be used. For neutral/alkaline Ferro/Ferri-cyanide solutions can be used, but may not be compatible with the flow battery chemistry) Shunt currents – If the OCV cell with internal reference is used for mappeing out all potentials, there will be shunt currents through the OCV cell. This can destroy accuracy of the measurements. | ||
References and Suggested Reading
In connection with this note, it is suggested to read the following papers to get an overall understanding of the methodology and theory.
-
- Gonzalez, G., & Peljo, P. (2025). Experimental Set‐Up for Measurement of Half‐Cell‐and Over‐Potentials of Flow Batteries During Operation. Batteries & Supercaps, 8(2), e202400394.
- Langner, J., Melke, J., Ehrenberg, H., & Roth, C. (2014). Determination of overpotentials in all vanadium redox flow batteries. ECS Transactions, 58(37), 1.
Interested? We’d like to hear from you!
Don’t hesitate to contact us with any kind of inquiries at
sales@redox-flow.com or call Mikkel Kongsfelt at +45-3126-2040